Businesses generate huge amounts of data every day. This data can be of enormous value.
From interactions with customers via online purchases and service inquiries to operational metrics such as inventory levels and production rates, the data comes in all shapes and sizes. However, it can become a great asset for growth when analyzed correctly.
This is where Business Intelligence (BI) comes in. The tough-talking crude data must be transformed into actionable information, which is possible only through powerful BI tools. Of all the BI tools out there, the gold standard for reporting and data analysis remains Microsoft’s Power BI.
But what happens when this game-changing BI tool of Power BI merges with this other game-changing technology of Artificial Intelligence?
Are you a business owner, entrepreneur, CTO, or COO looking to integrate AI to enhance your data analysis or seeking the most effective way to leverage your data for business growth? Read on because this blog has something for you.
We’ll explore Power BI AI integration, AI-driven Power BI insights, predictive analytics with Power BI and AI, and more.
What Is Power BI?
Power BI is a powerful tool by Microsoft that allows organizations to unlock the value of their data. It is a suite of software services, apps, and connectors that can be used together to turn your company’s data into insightful visualizations and actionable information.
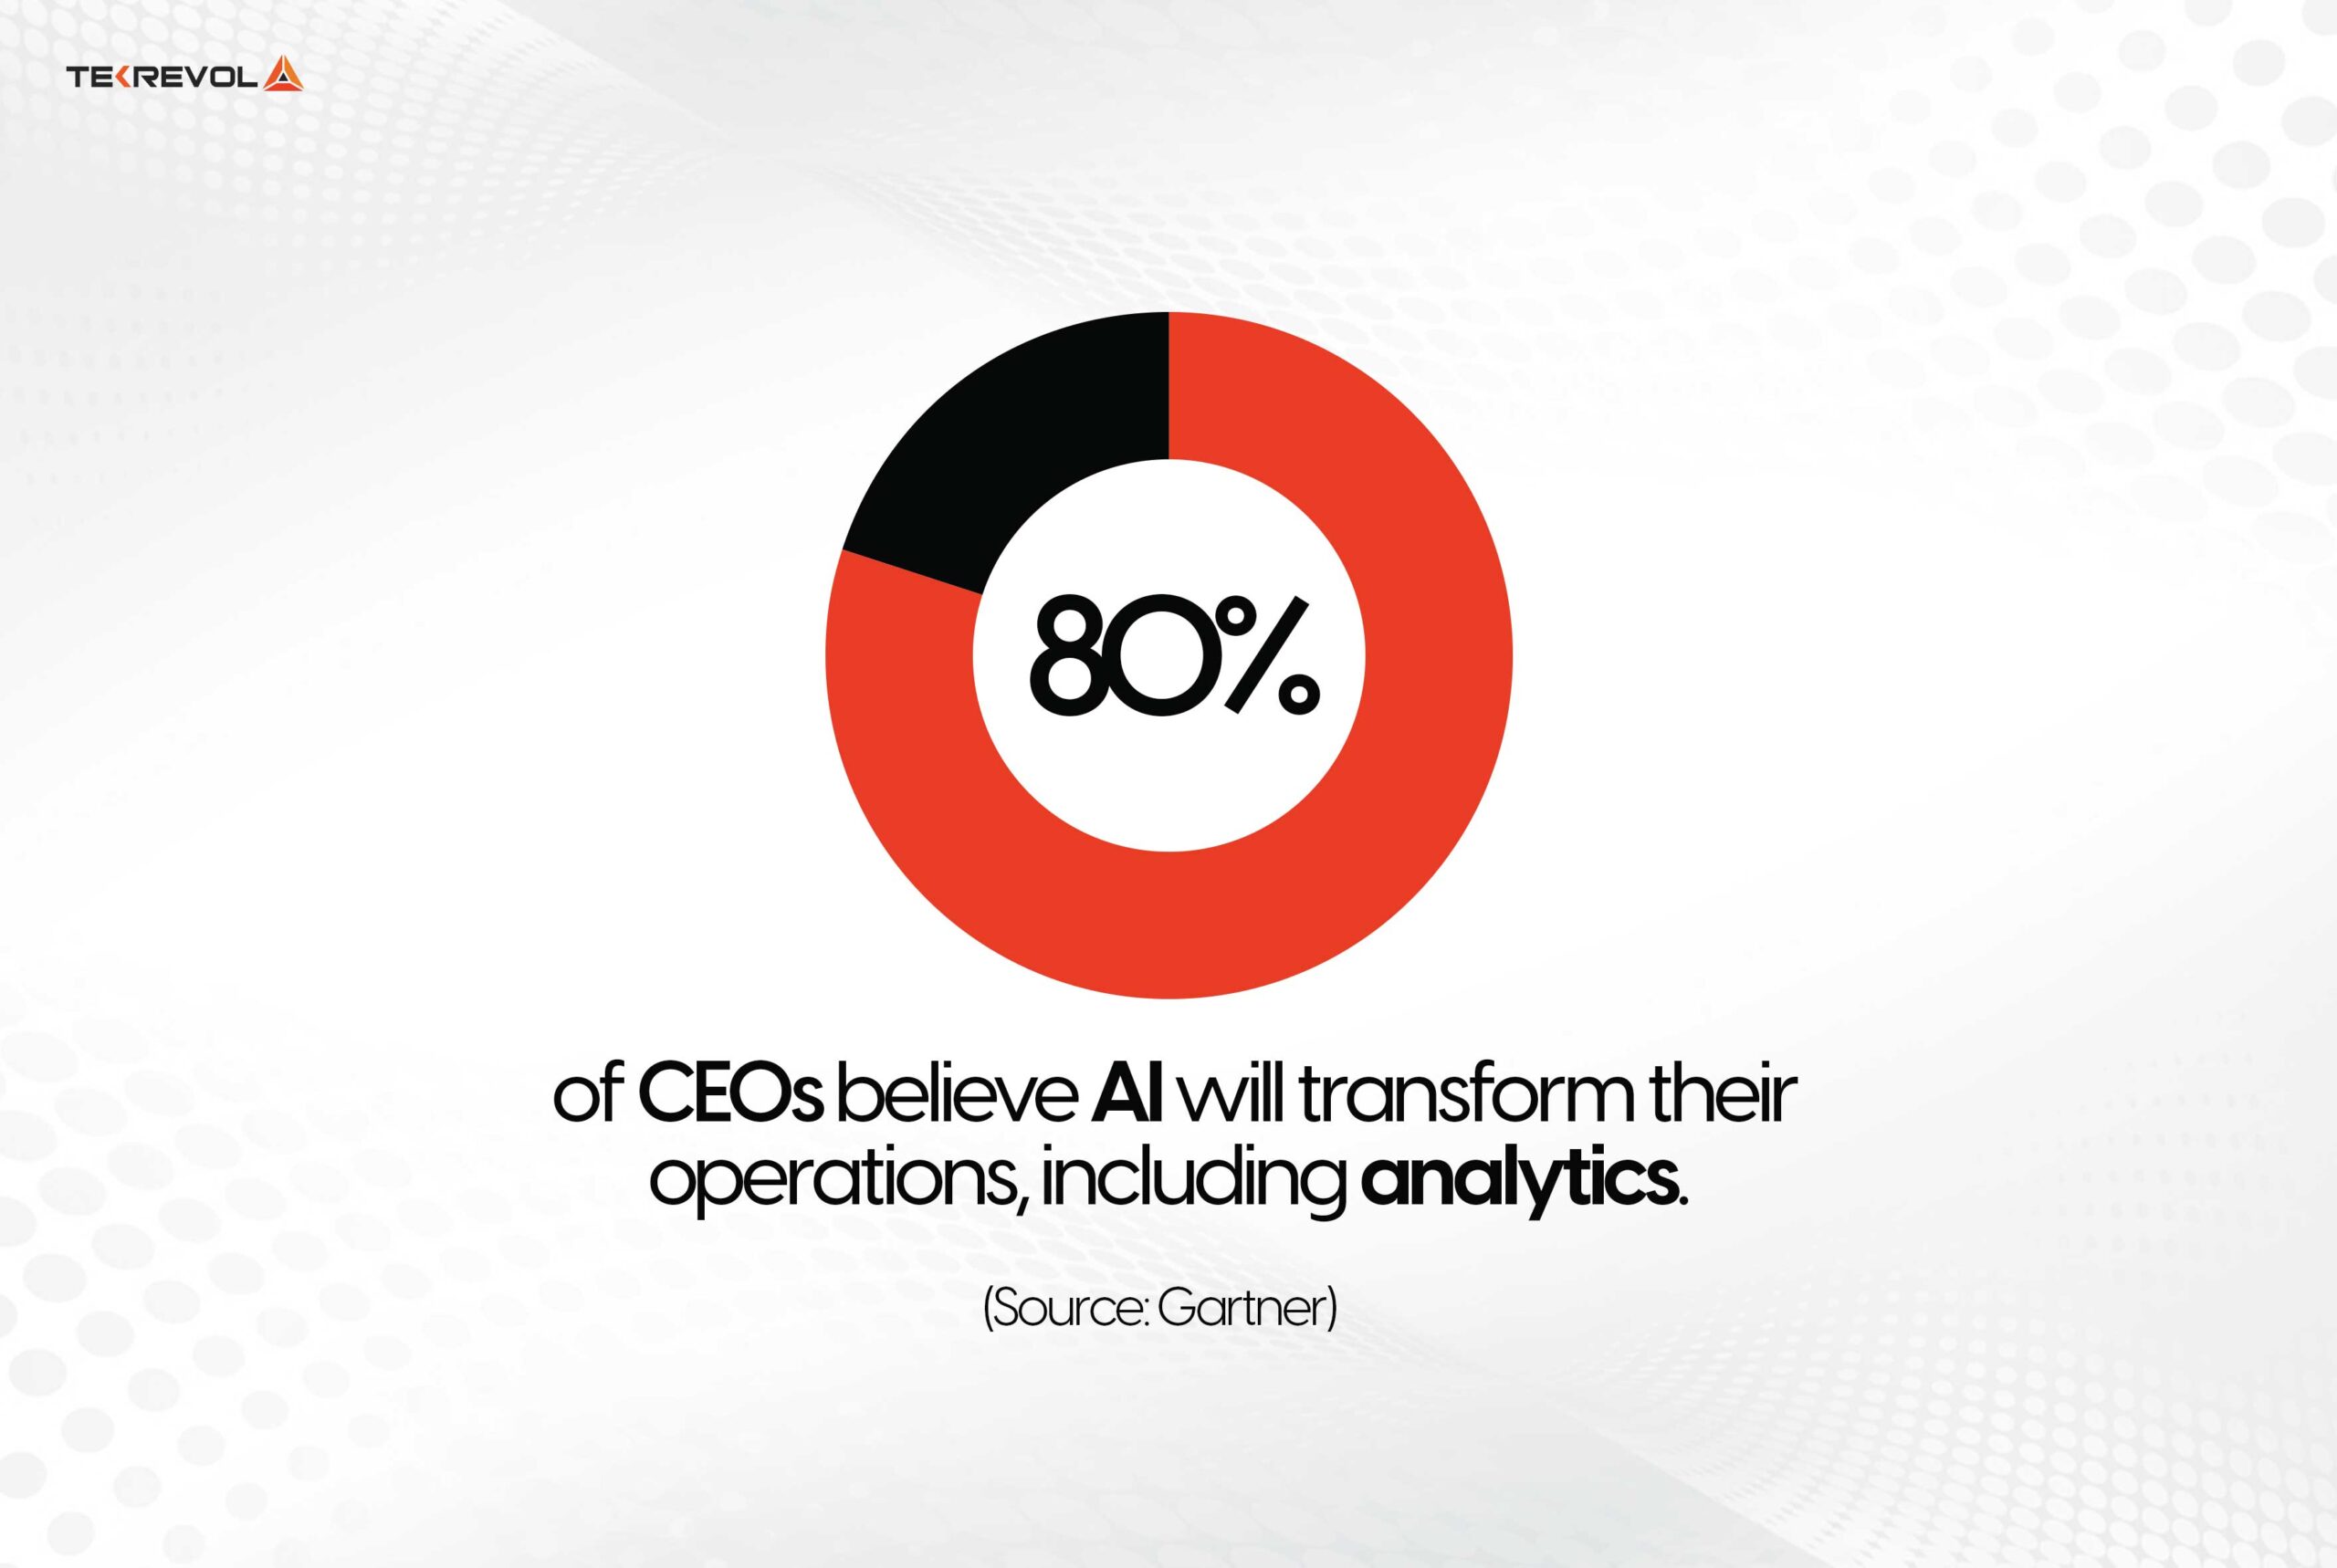
According to Gartner, over 97% of Fortune 500 companies are using Power BI for analysis and reporting. Power BI allows technical and nontechnical users to easily connect to many kinds of data, create interactive reports and dashboards, and easily share those insights throughout the organization.
One of its greatest strengths is its power to aggregate data from several sources into one unified view. Businesses can therefore get a complete visual of their operations, customer behavior, and market trends in real time.
Companies using Power BI make decisions that are faster and more informed with a drive toward growth and efficiency.
How Is AI Used In Business Intelligence (BI)?
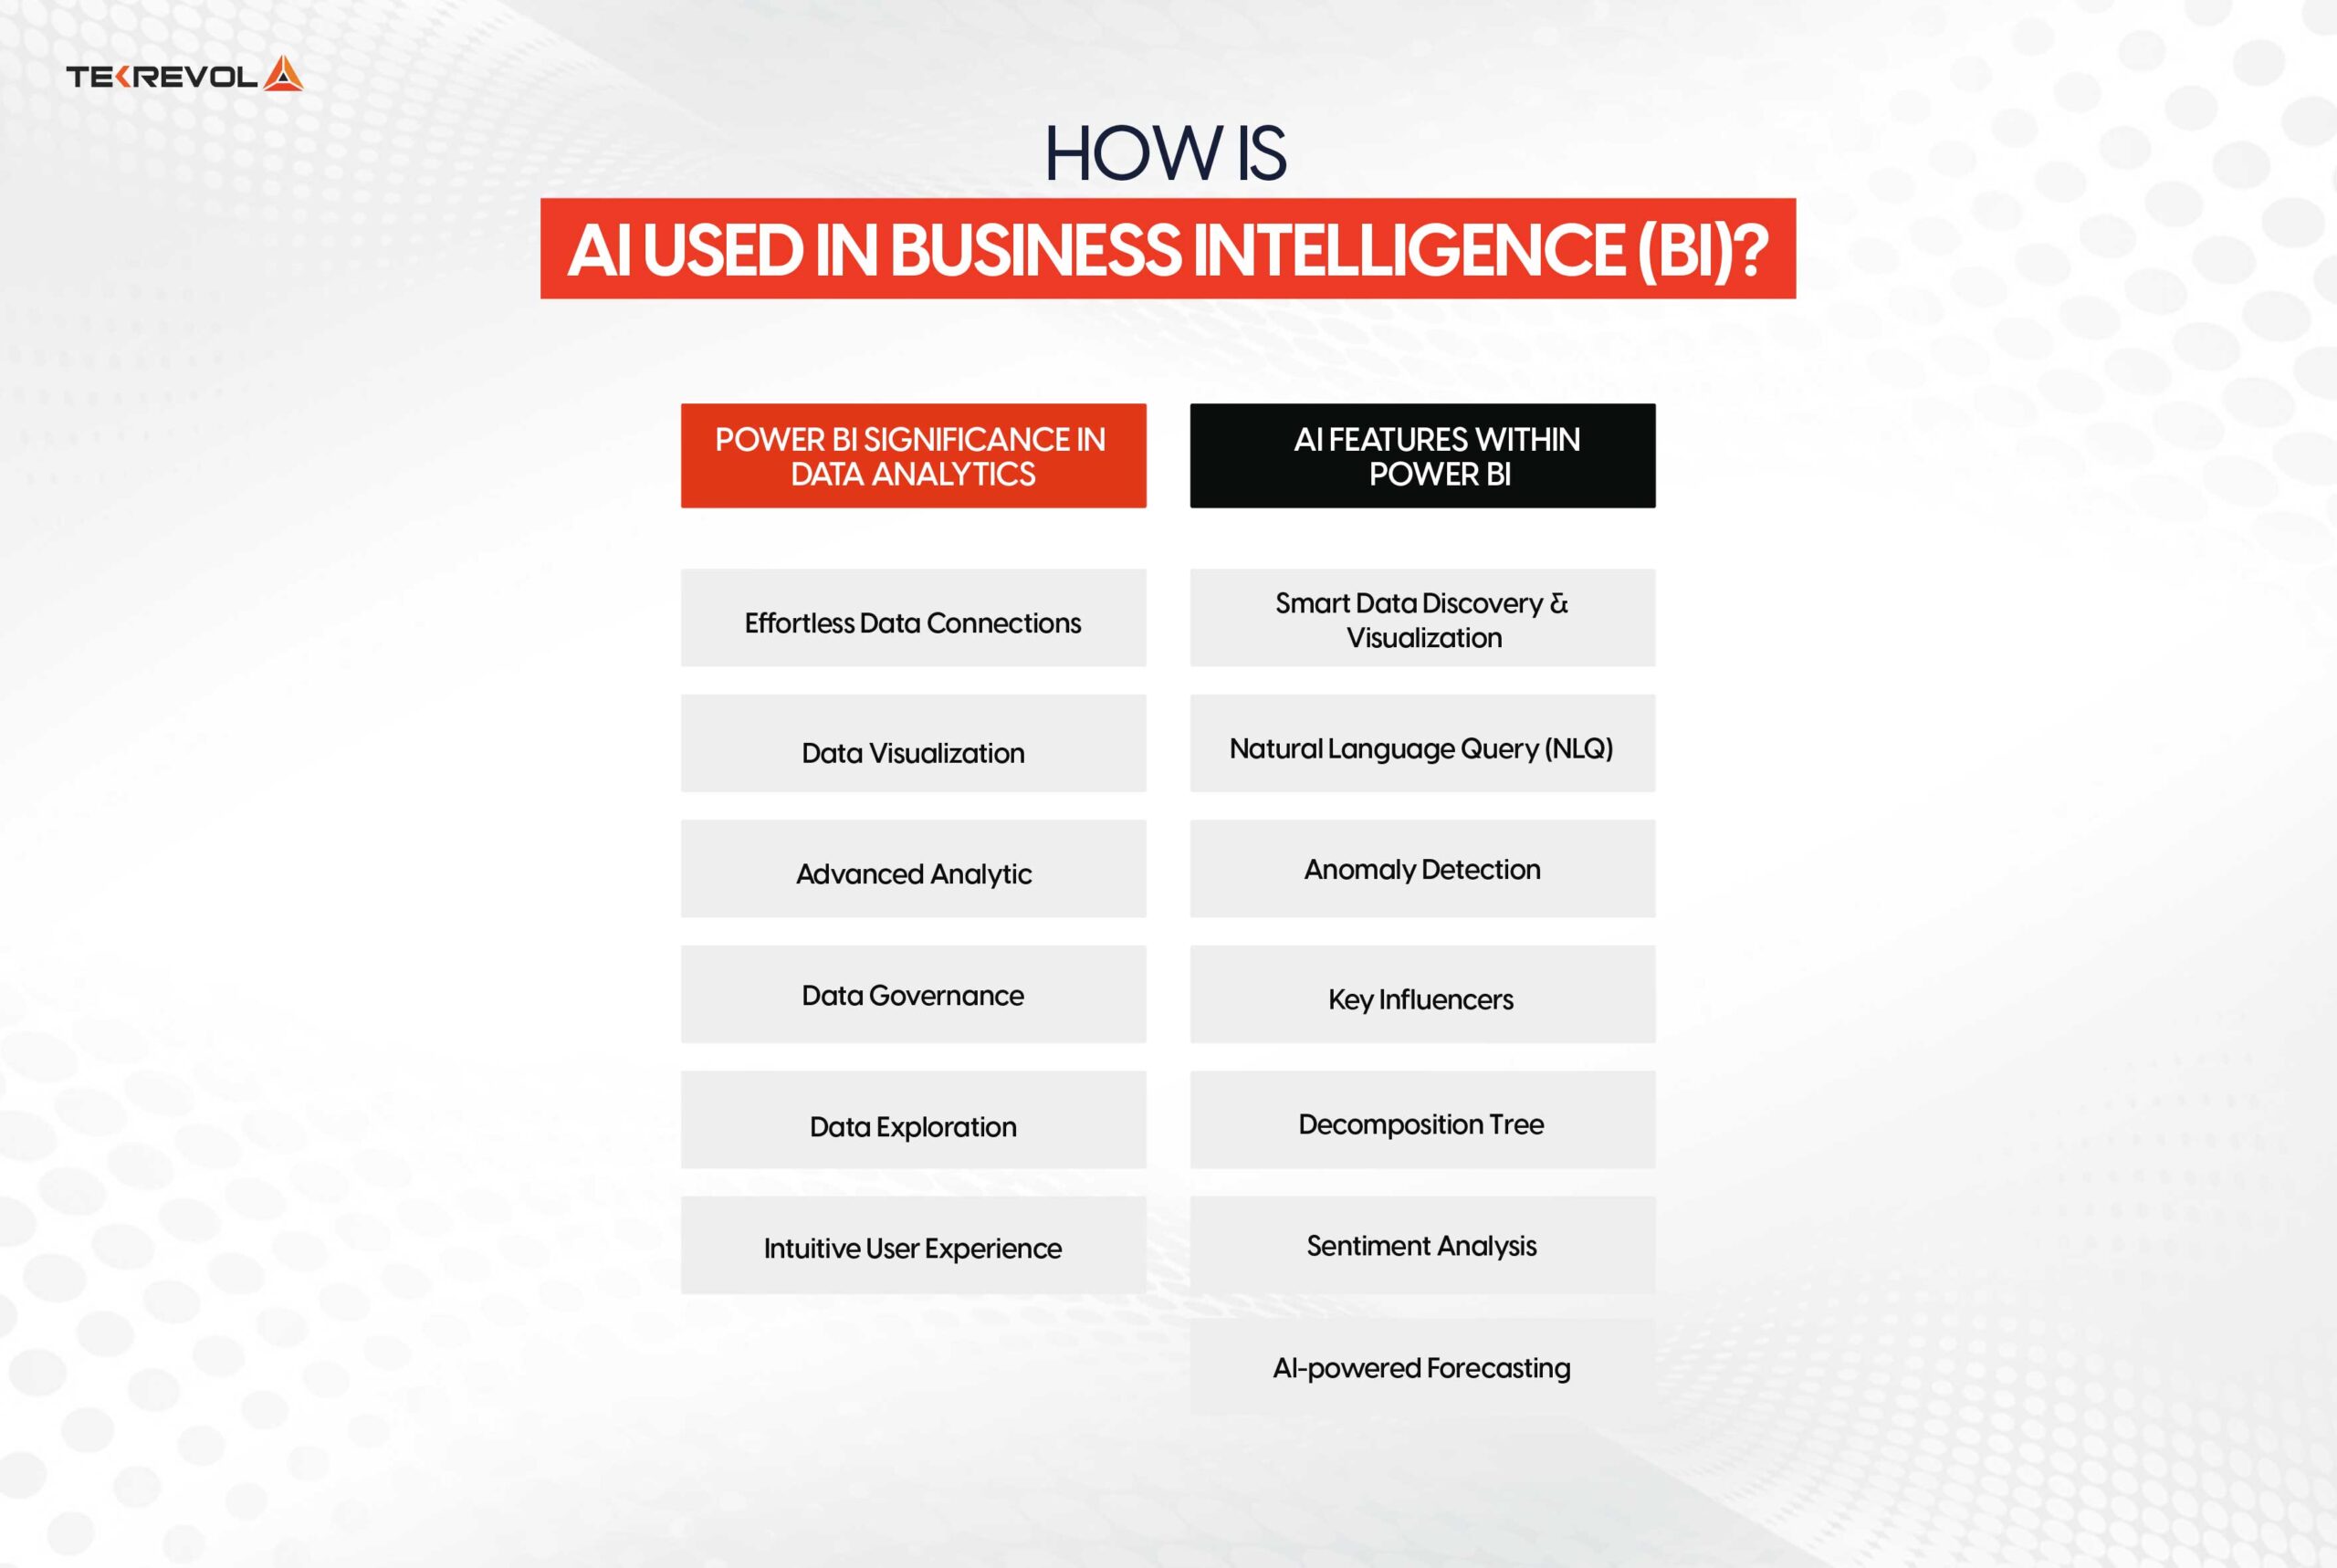
Stats suggest that 93% of business owners regard AI as an exceptionally valuable tool in enhancing decision-making. Artificial intelligence, combined with business intelligence, changes the game of how organizations utilize their data.
AI-driven insights can unlock a new dimension in the business world: data-driven decision-making. Applying advanced analytics and machine learning algorithms to BI data, AI automates pattern identification, trend observation, and anomaly discovery.
AI-driven Power BI insights enable organizations to make more accurate predictions, optimize their operations, and find hidden opportunities.
Before moving on to Power BI AI specifics, let’s briefly see how AI works inside Power BI.
- Automated Insights: AI algorithms analyze data, find patterns and bring out automatic insights. This saves decisions and effort in manual work.
- Predictive Analytics: AI models predict future outcomes based on past data. Such predictions of Power BI provide insight into better resource allocation, inventory management, and much more.
- Natural Language Processing (NLP): AI-powered NLP lets users query data using natural language. It thus fills the gap between technical and non-technical users, making the technology of Power BI more accessible.
- Transform Your Business with the Power of AI
- Partner with us to gain AI-driven Power BI insights. Enhance decision-making and stay ahead in your industry with tailored AI solutions.
Key Features Of AI Integration In Power BI
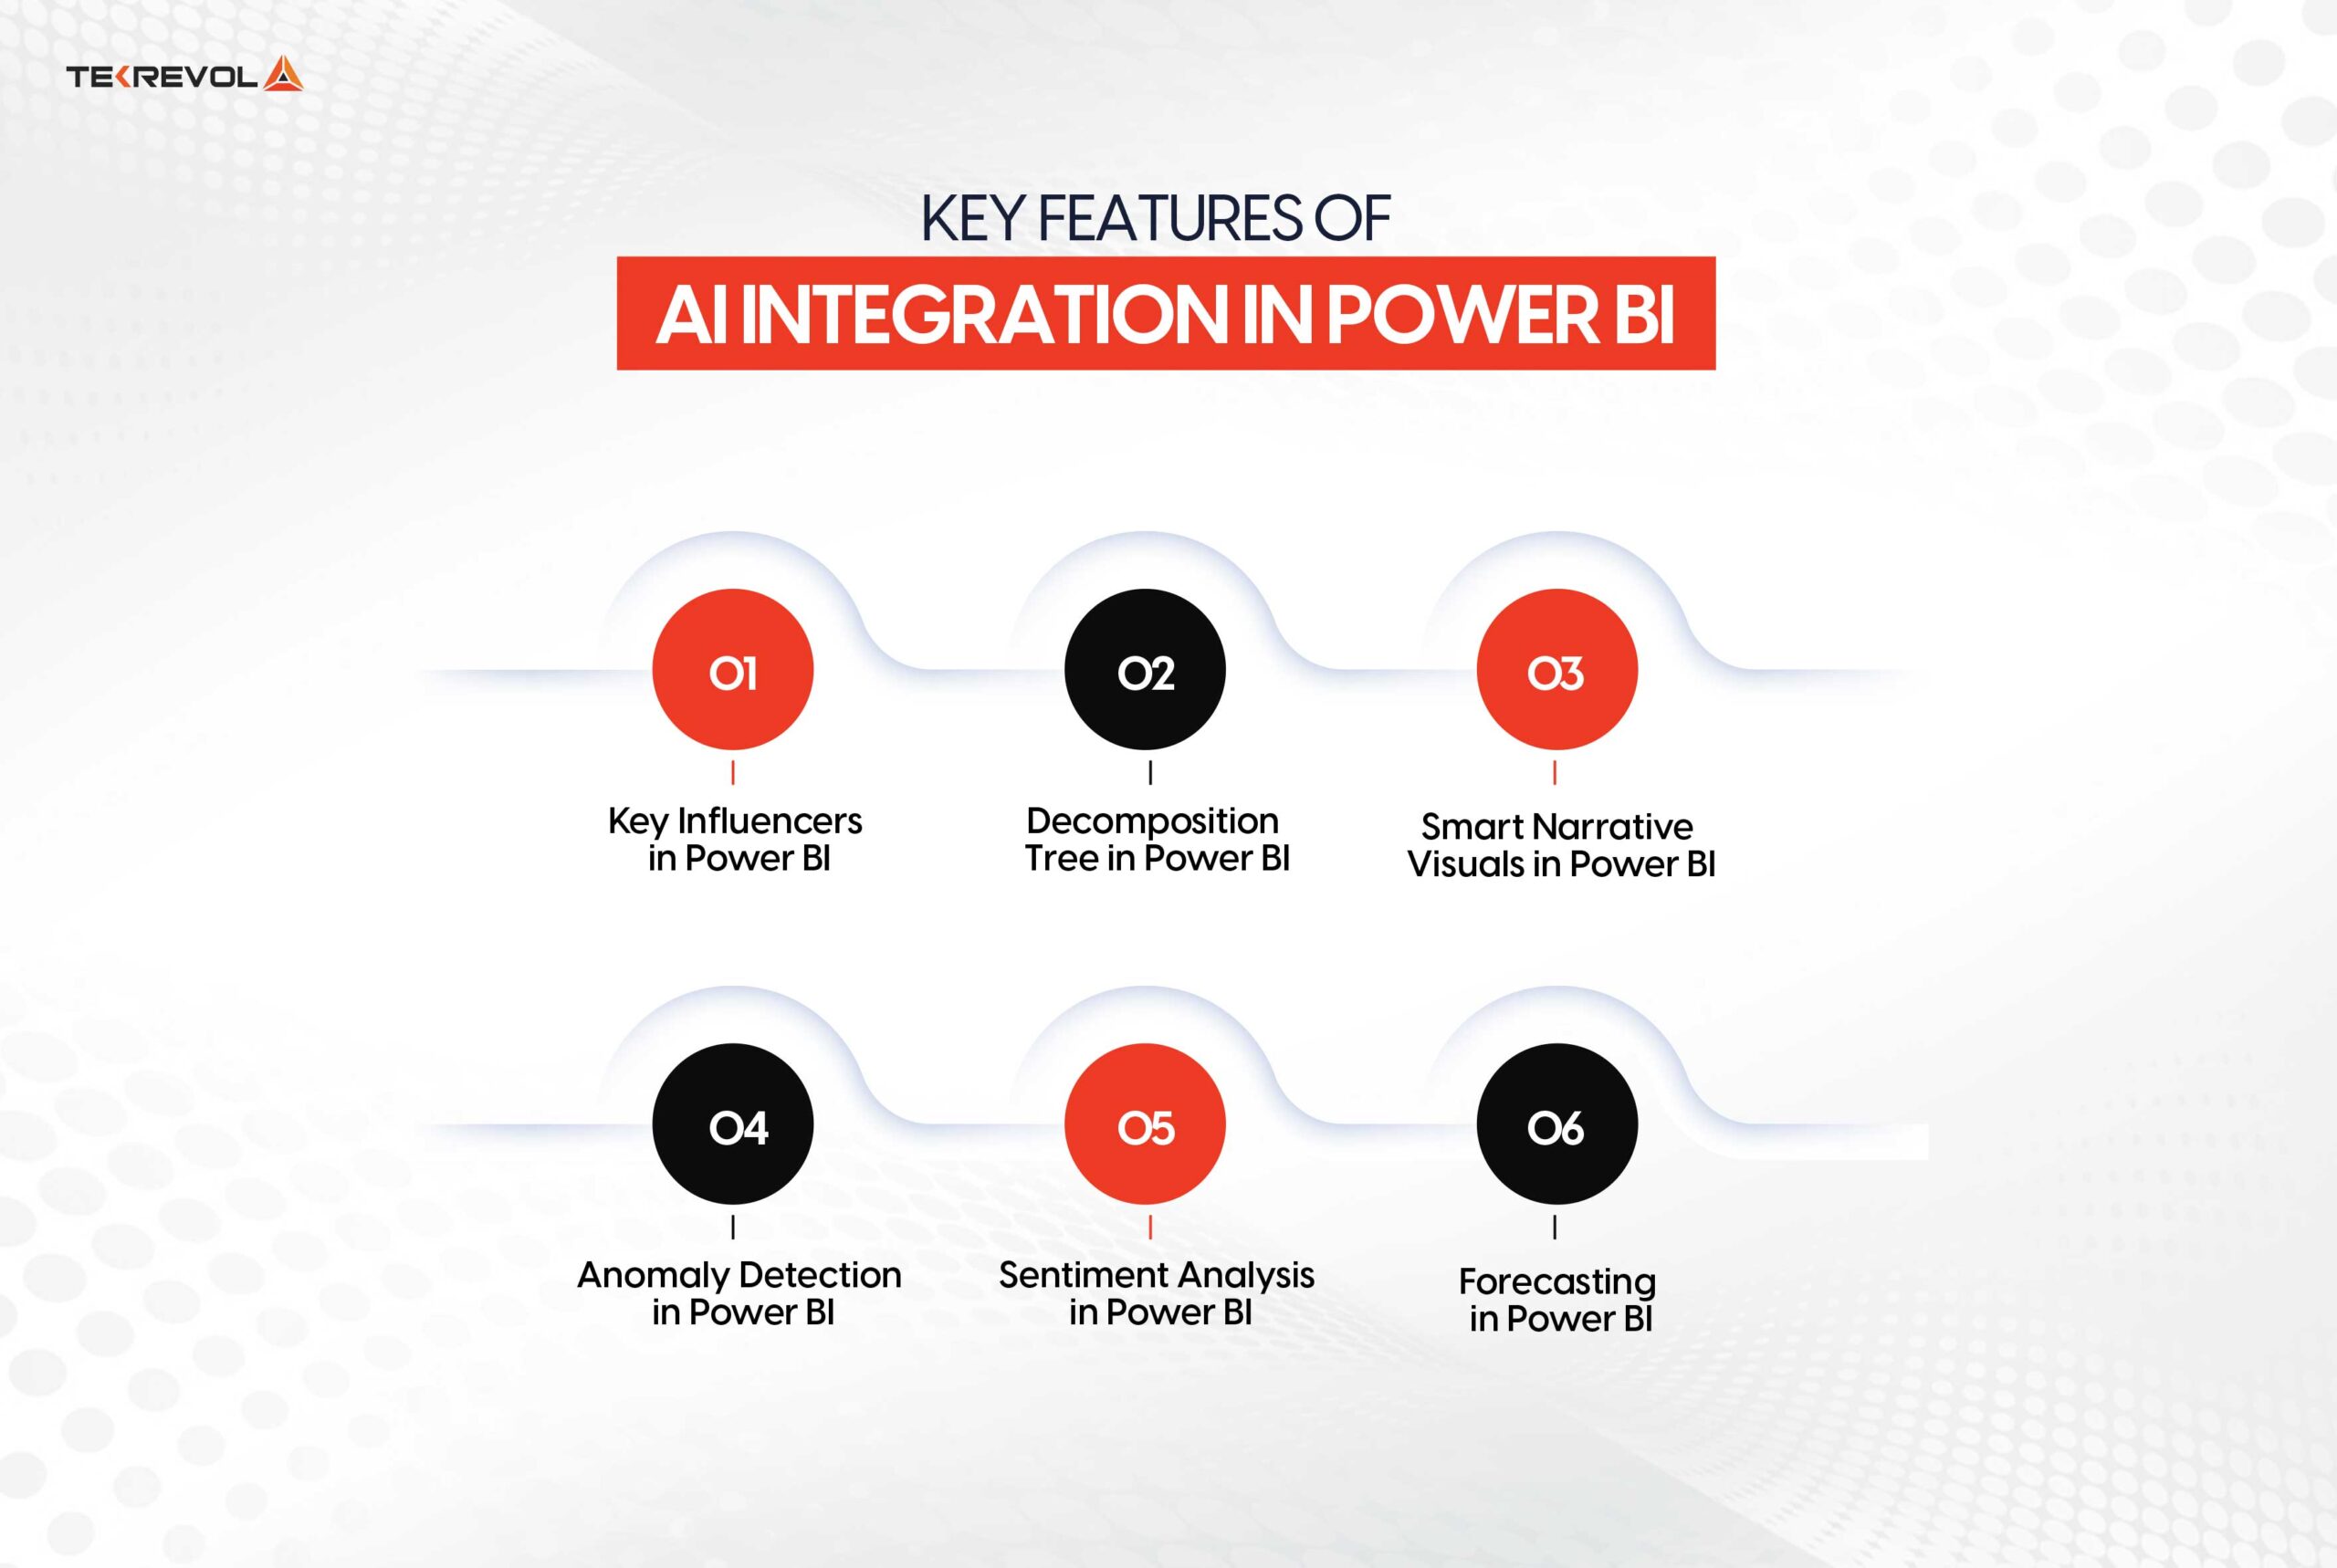
Power BI embeds numerous AI innovations that analyze and visualize data much deeper, which helps businesses see what’s really going on and make better-informed decisions.
Key Influencers in Power BI
The Key Influencers visualization identifies areas driving strong movement in a given metric, helping to answer questions such as, “What is driving sales?” or “What variables are driving customer churn?” Analyzing relationships between different attributes of data uncovers the driving forces behind outcomes.
Example: An online retailer wishes to know why certain products will sell well in specific regions. The Key Influencers visualization shows associations between product characteristics, price, and customer demographics with AI-powered Power BI insights.
Decomposition Tree in Power BI
The Decomposition Tree represents hierarchical data breakdowns allowing drilling down on data across multiple dimensions. It is useful in exploring hierarchies, including the analysis of sales by region, product category, and individual products.
Example: A manufacturing company seeks to understand its revenue distribution across different product lines. The Decomposition Tree reveals the contribution of each level (e.g., product category, subcategory, SKU), providing Power BI intelligent insights through AI.
Smart Narrative Visuals in Power BI
Smart Narrative provides natural language explanations for visuals by turning data insights into plain language. It automatically explains trends, outliers, and patterns and enhances report narratives.
Example: An executive dashboard shows revenue trends. Smart Narrative describes why revenue increased in Q3, highlighting key contributing factors.
Anomaly Detection in Power BI
This indicates anomalous data points, which are vital in detecting fraud, quality control, and performance monitoring. It finds sudden spikes, drops, or irregular patterns in time-series data.
Example: A financial institute monitors transaction volumes. Anomaly Detection alerts for anomalous spikes that would denote fraud, demonstrating the use of AI in Power BI for data analysis purposes.
Sentiment Analysis in Power BI
Sentiment Analysis evaluates text data (e.g., customer reviews, social media posts) and assigns sentiment scores (positive, negative, neutral). It helps analyze customer feedback sentiment, understand brand perception, and identify areas for improvement.
Example: A hotel chain analyzes guest reviews. Sentiment Analysis reveals which aspects (service, cleanliness, amenities) impact overall satisfaction, demonstrating how to use AI in Power BI for smarter business insights.
Forecasting in Power BI
Forecasting predicts future values based on historical data that is accurate for demand planning and resource allocation. It applies for sales, or inventory, or even website traffic.
Example: An e-commerce company. It estimates holiday sales. It first forecasts the demand for specific products during the seasonal sales and allocates the inventory, illustrating predictive analytics with Power BI, and AI.
These AI capabilities in Power BI allow businesses to gain deeper insights, informed decisions, and growth through in-depth data analysis.
Leveraging Power BI With AI For Predictive Analytics
Predictive analytics involves using historical data to forecast future outcomes. The machine learning algorithms in Power BI identify patterns in data for the purpose of making such forecasts.
Applications of predictive analytics, using Power BI and AI, have shown that companies report an average increase of 20% in being more accurate in their prediction. This increases the accuracy of decisions on a business basis and performance.
Most predictions can be made manually by analyzing data by checking previous trends and patterns. However, in complex and huge data cases, the use of advanced techniques is necessary. These include:
- Data mining
- Statistics
- Predictive data modeling
- Algorithms
- Machine learning
Power BI is fully prepared for high-end analytics requirements and is an excellent tool for predictive data analytics.
The following are some of the options with which you can make predictions using Power BI predictive analytics:
- Using DAX
- R and Python scripts
- Power BI inbuilt visuals
- Azure ML integration
- Enhance Decision-Making with AI-Powered Insights
- Experience Power BI predictive insights through our specialized AI development services. Make informed decisions that drive your business forward.
Steps For Creating Predictive Models In Power BI
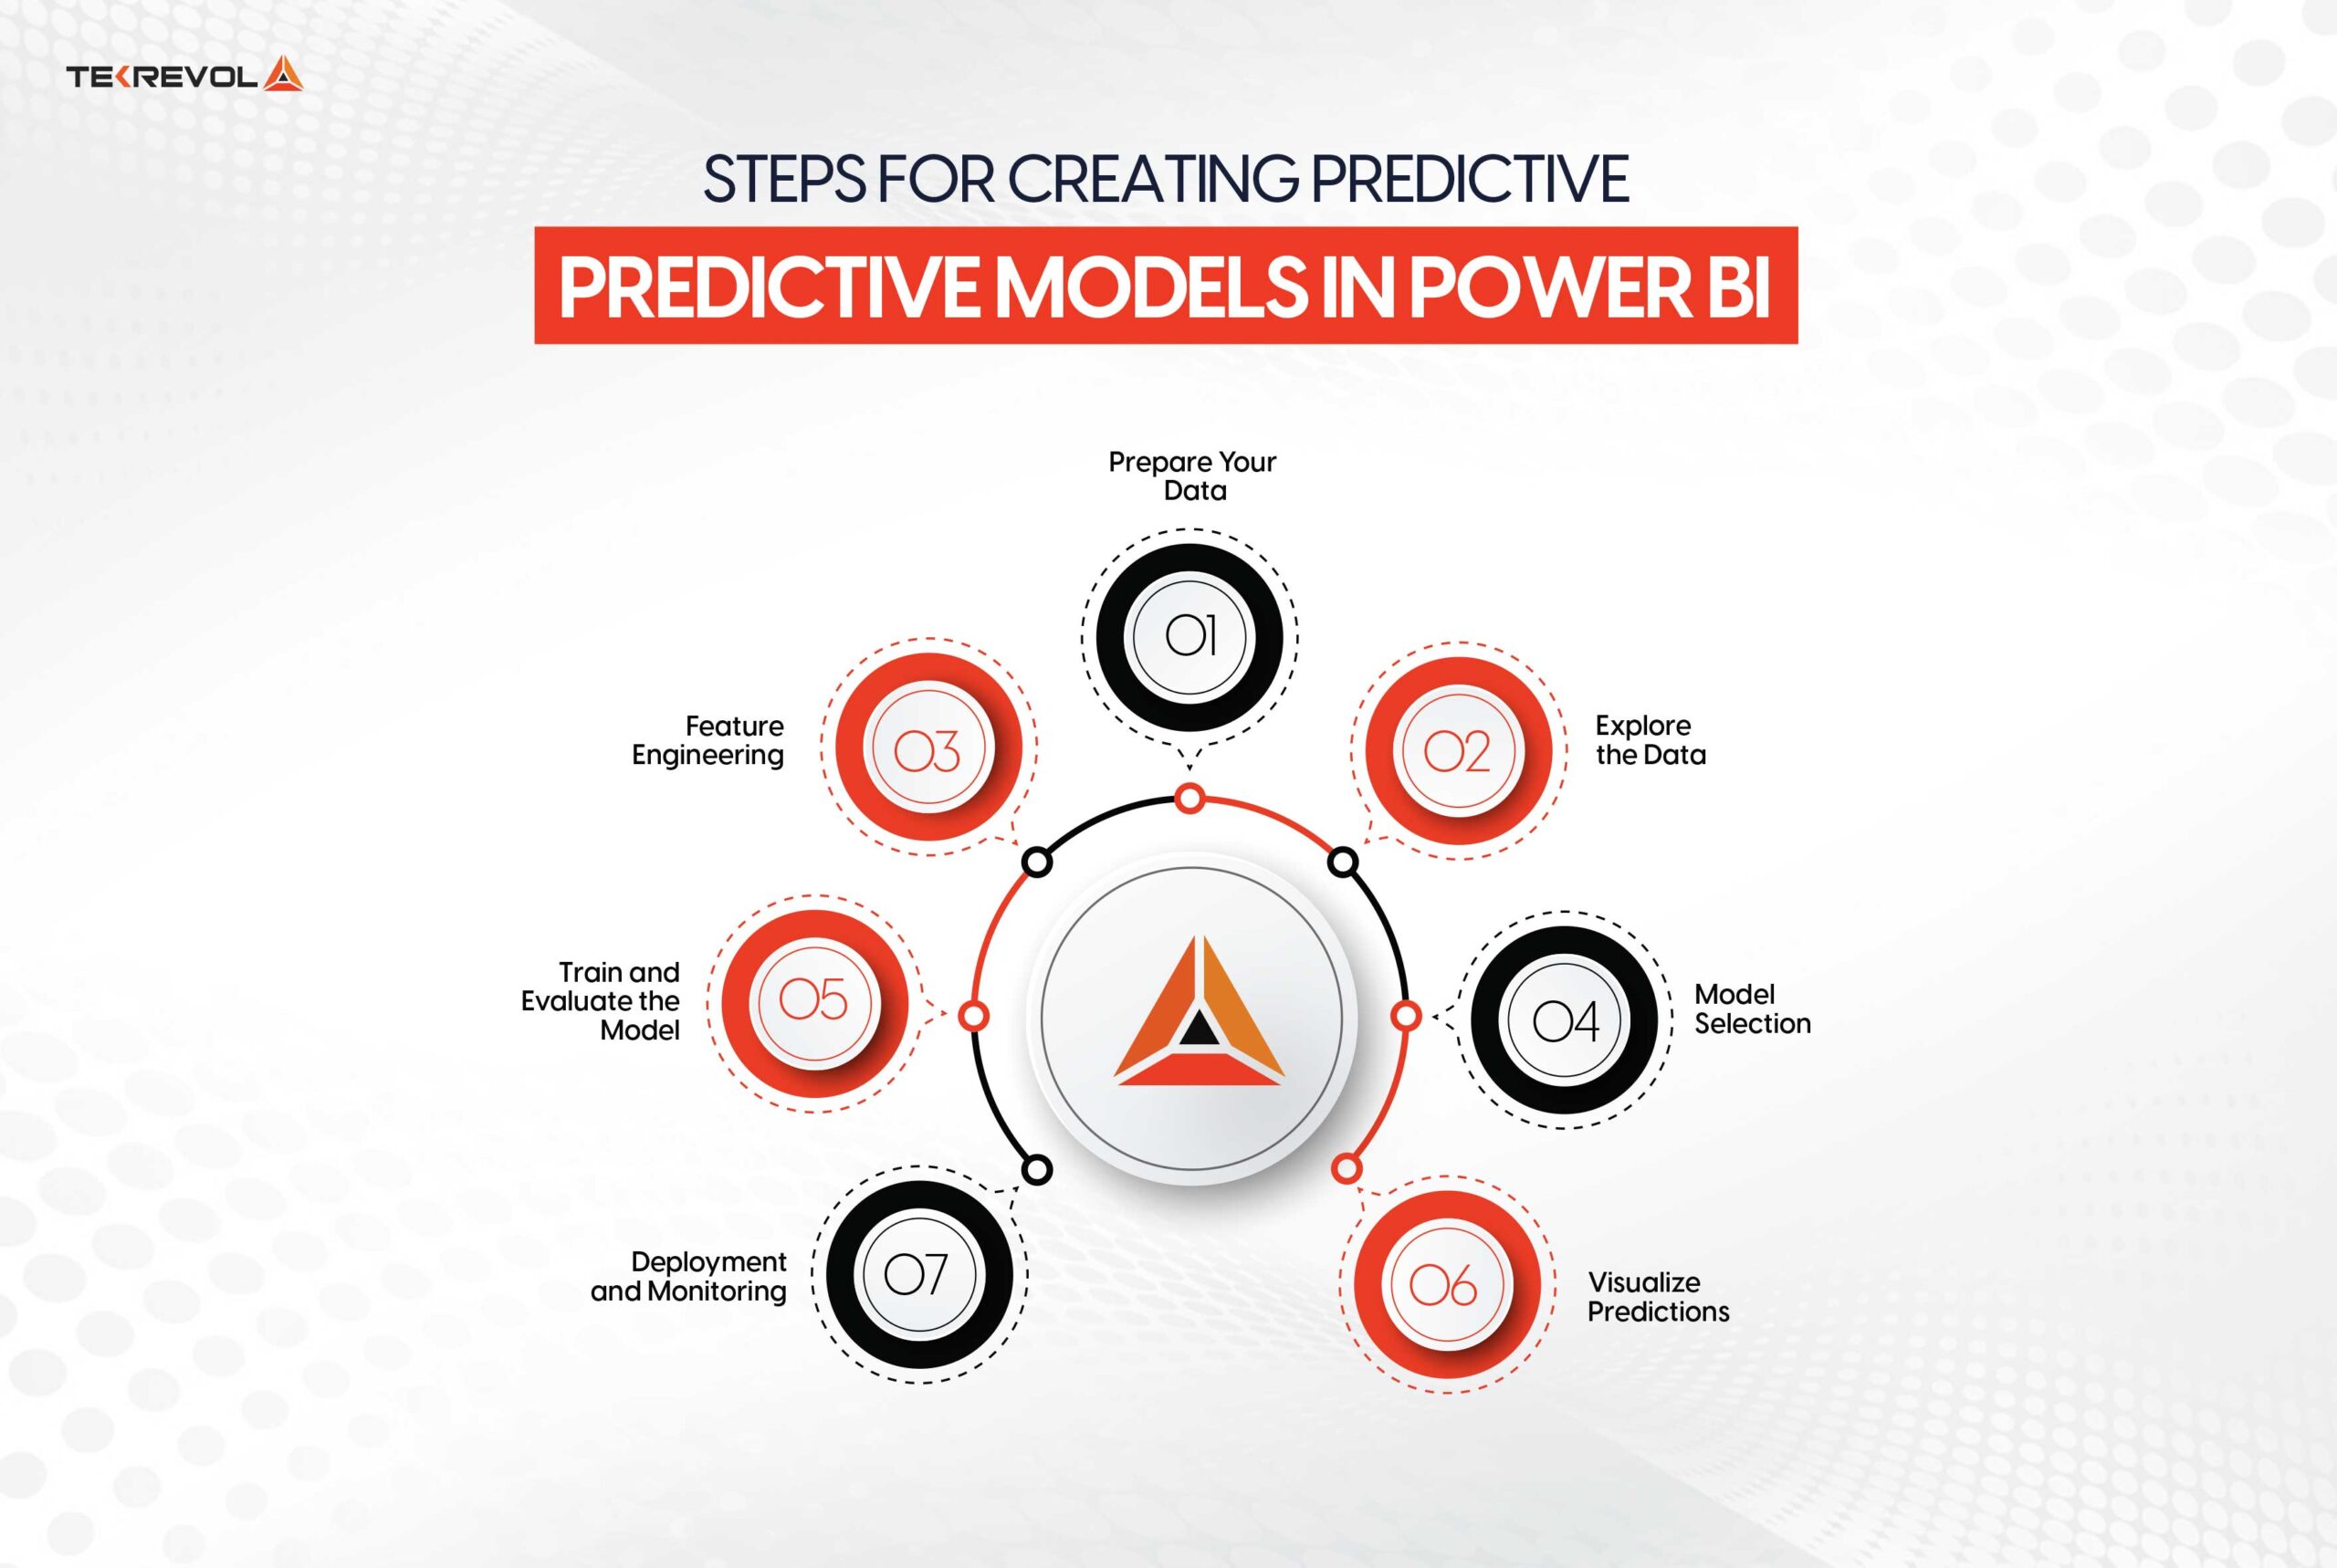
Creating predictive models in Power BI can significantly enhance your decision-making capabilities. Here’s a concise overview of the steps involved:
-
Prepare Your Data
Import your data set into Power BI via the “Get Data” option. Select the correct data source, for example, Excel or SQL Server, then upload the data to Power BI.
Analyze the quality of your data and do the necessary cleaning to remove duplicates and handle missing values using Power Query.
-
Explore the Data
Utilize Power BI’s visualization capabilities to explore the dataset visually. Create charts, graphs, and tables to uncover patterns, trends, and relationships within the data.
For example, scatter plots can be used to visualize correlations between variables or histograms to understand the distribution of numerical data.
-
Feature Engineering
Identify relevant features (variables) for the predictive model and engineer new features if needed. For example, if the dataset has a “date” column, extract other relevant features like what day it is or what month to find temporal patterns within the model.
-
Model Selection
Select an appropriate predictive algorithm based on the nature of your problem and dataset. For example, if you’re predicting sales revenue, consider using linear regression or decision tree regression.
Explore Power BI’s built-in machine learning algorithms under the “Analytics” pane.
-
Train and Evaluate the Model
Divide your dataset into training and test data (for example, 70/30 split for training and testing). Train the predictive model on the training data and verify it using evaluation metrics such as RMSE or R-squared.
-
Visualize Predictions
Visualize the predictions generated by your model using Power BI’s visualization options. Create interactive dashboards that showcase predicted outcomes alongside actual data to facilitate better decision-making.
-
Deployment and Monitoring
A perfect way to deploy your predictive model in Power BI is to embed it within reports and dashboards. You can track its performance over time by updating it periodically with fresh data and testing its accuracy.
Following these steps on how to use AI in Power BI for smarter business insights unlocks valuable information that drives strategic decisions in your organization and enhances overall efficiency using AI-driven Power BI insights.
- Ready to Transform Your Data Strategy?
- Partner with a leading provider of AI-driven Power BI insights to unlock actionable intelligence for your business.
Use Cases Of Predictive Analytics In Various Industries
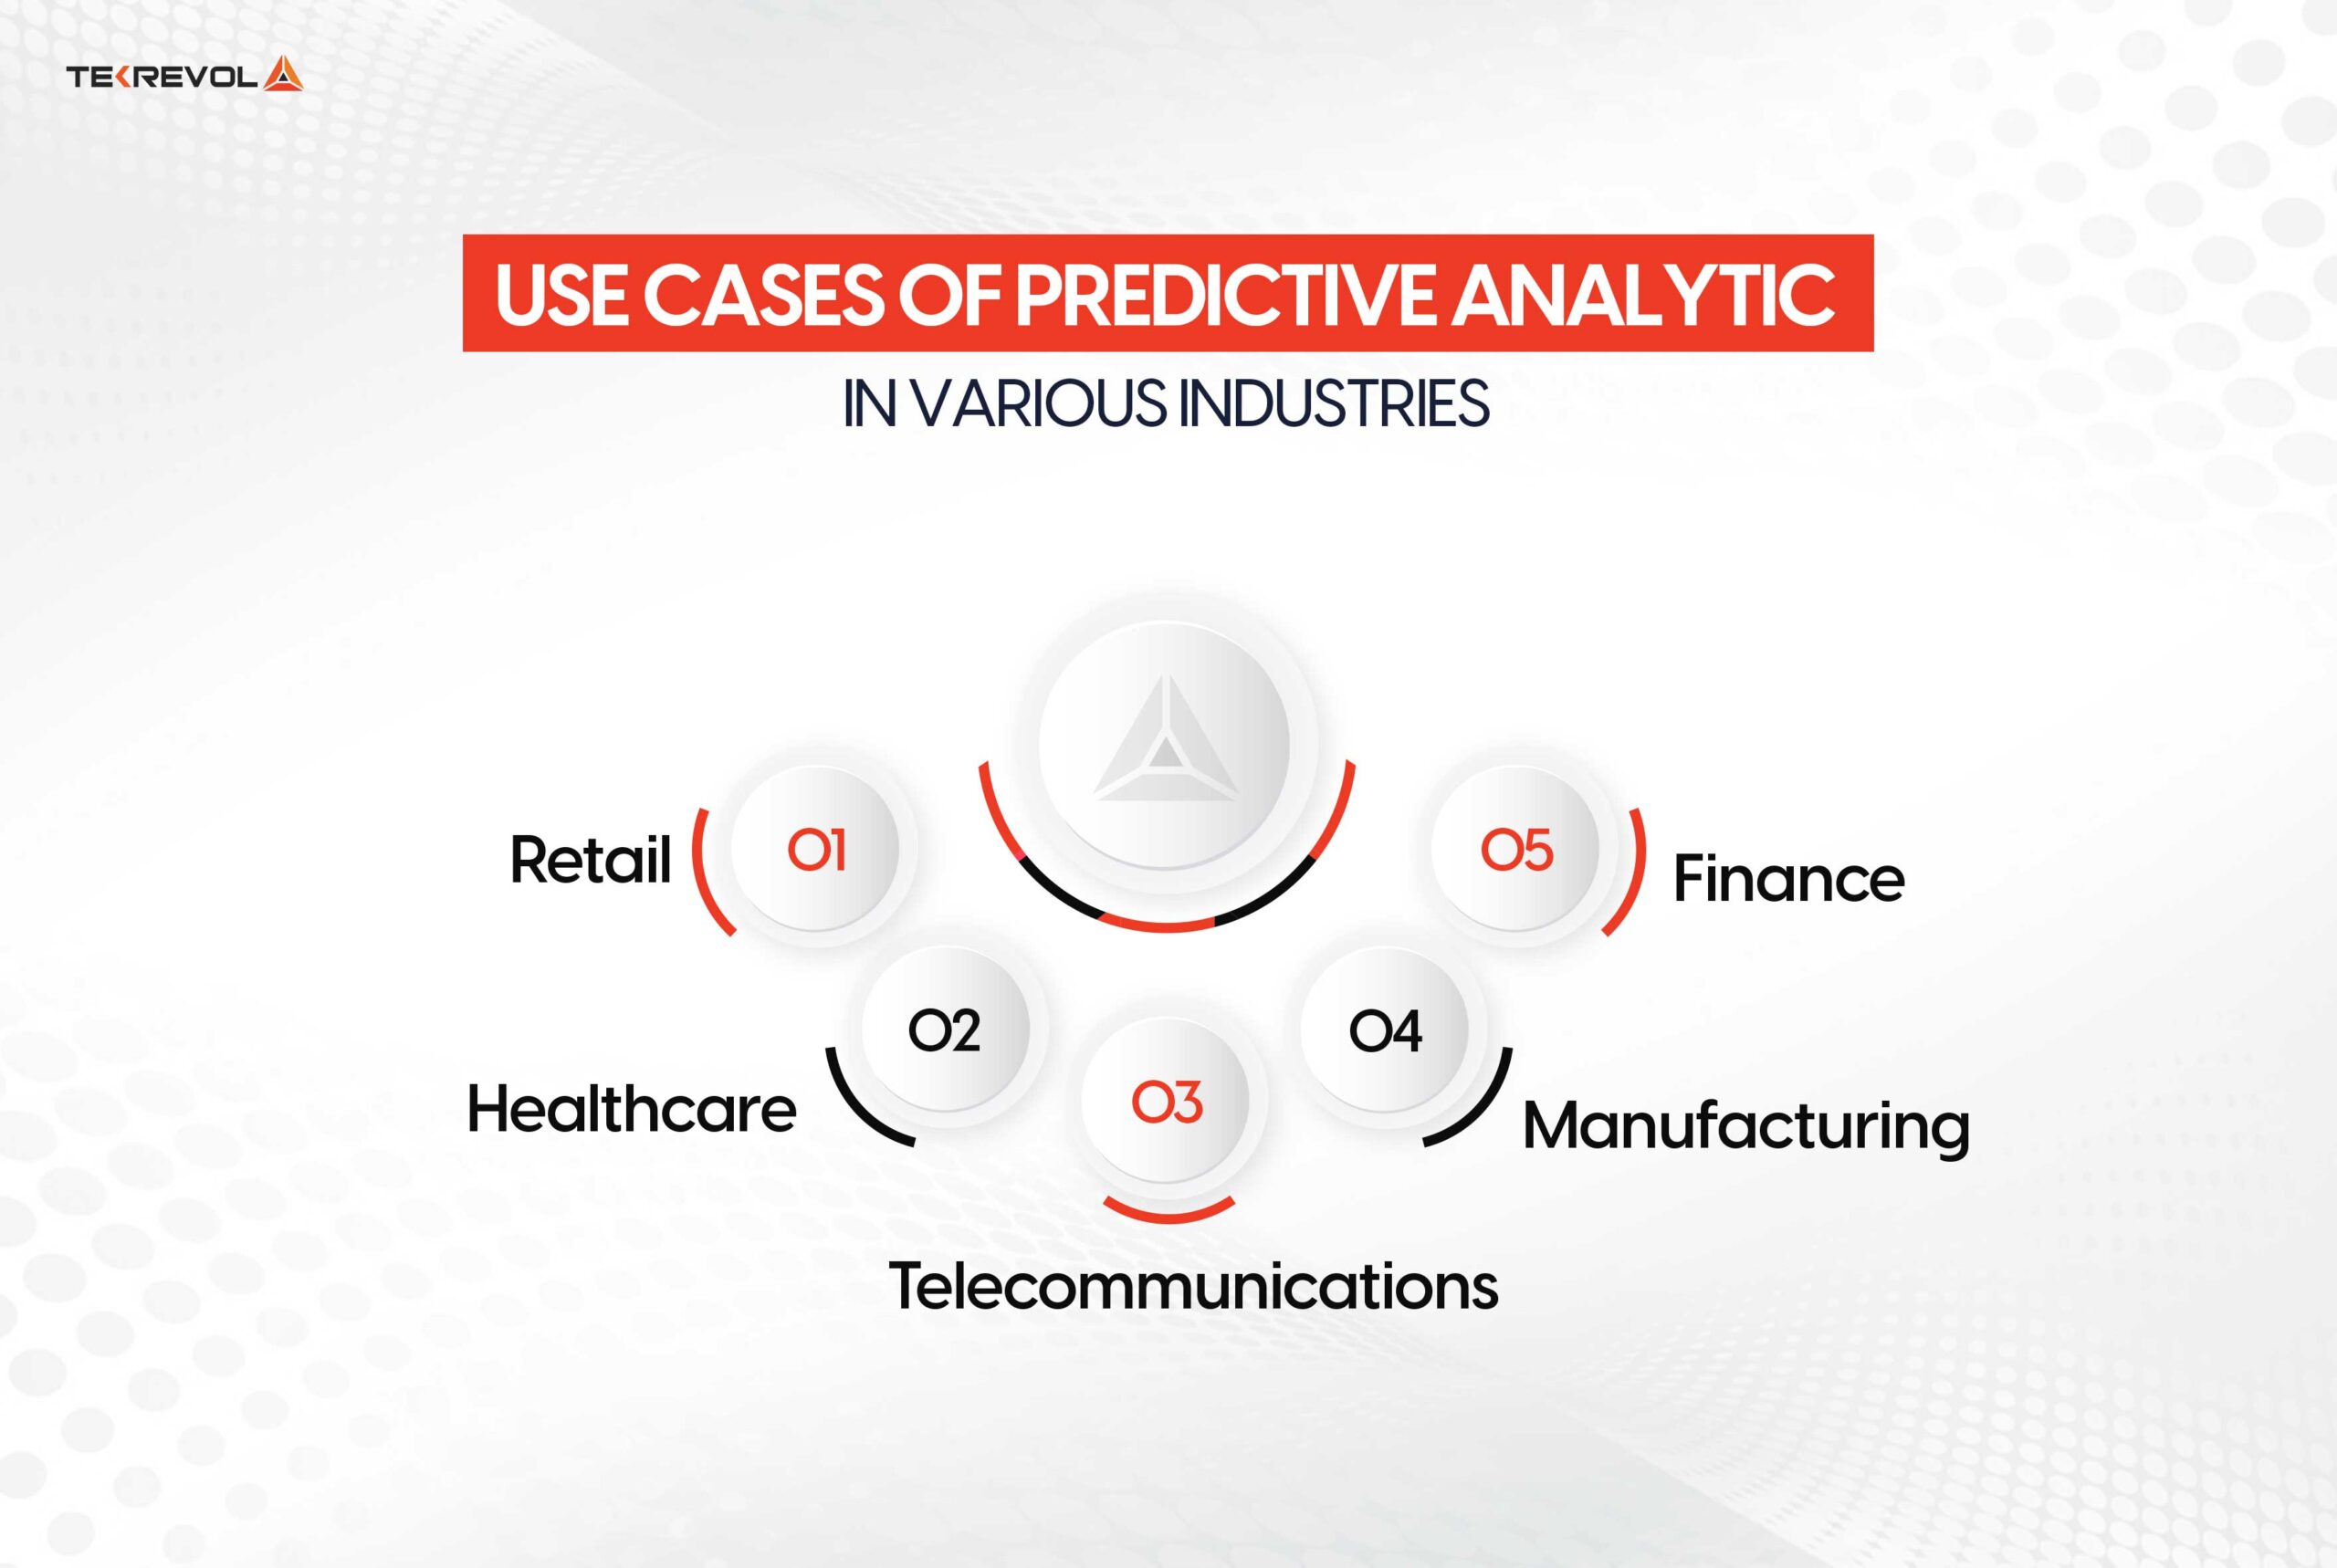
Predictive analytics, powered by AI, is transforming industries by enabling data-driven decision-making and forecasting. Here are some notable applications across various sectors:
Retail
Retailers apply predictive analytics for product demand prediction, managing inventory, and marketing. For example, Walmart uses Dask, an AI software, to predict the demand for 500 million combinations of store items, thereby ensuring its availability in stores.
Healthcare
In the health sector, predictive analytics helps improve patient care and efficient use of healthcare systems. Fractal Analytics works with health service providers to predict patient inceptions and optimize workforce levels, thus facilitating better scores in patient outcomes and resource use.
Finance
Financial organizations employ predictive analytics to assess risks and detect fraud. Capital One utilizes Dask to speed up ETL and machine learning pipelines and improve their finance modeling and decision-making.
Manufacturing
Manufacturers use predictive analytics to monitor equipment health and avoid downtime. Siemens used AI models in machinery failure prediction. It enables them to schedule regular maintenance to avoid downtime and operational disruptions.
Telecommunications
Telecommunication businesses use predictive analytics for network performance management and customer satisfaction. For instance, the NWDAF by Nokia uses AI to predict potential network issues, such that interventions are timely and service quality is enhanced.
The applications of these concepts show how AI-powered insights of Power BI for business intelligence can indeed spark efficiency and innovation across industries.
Benefits Of Integrating AI With Power BI For Data Insights
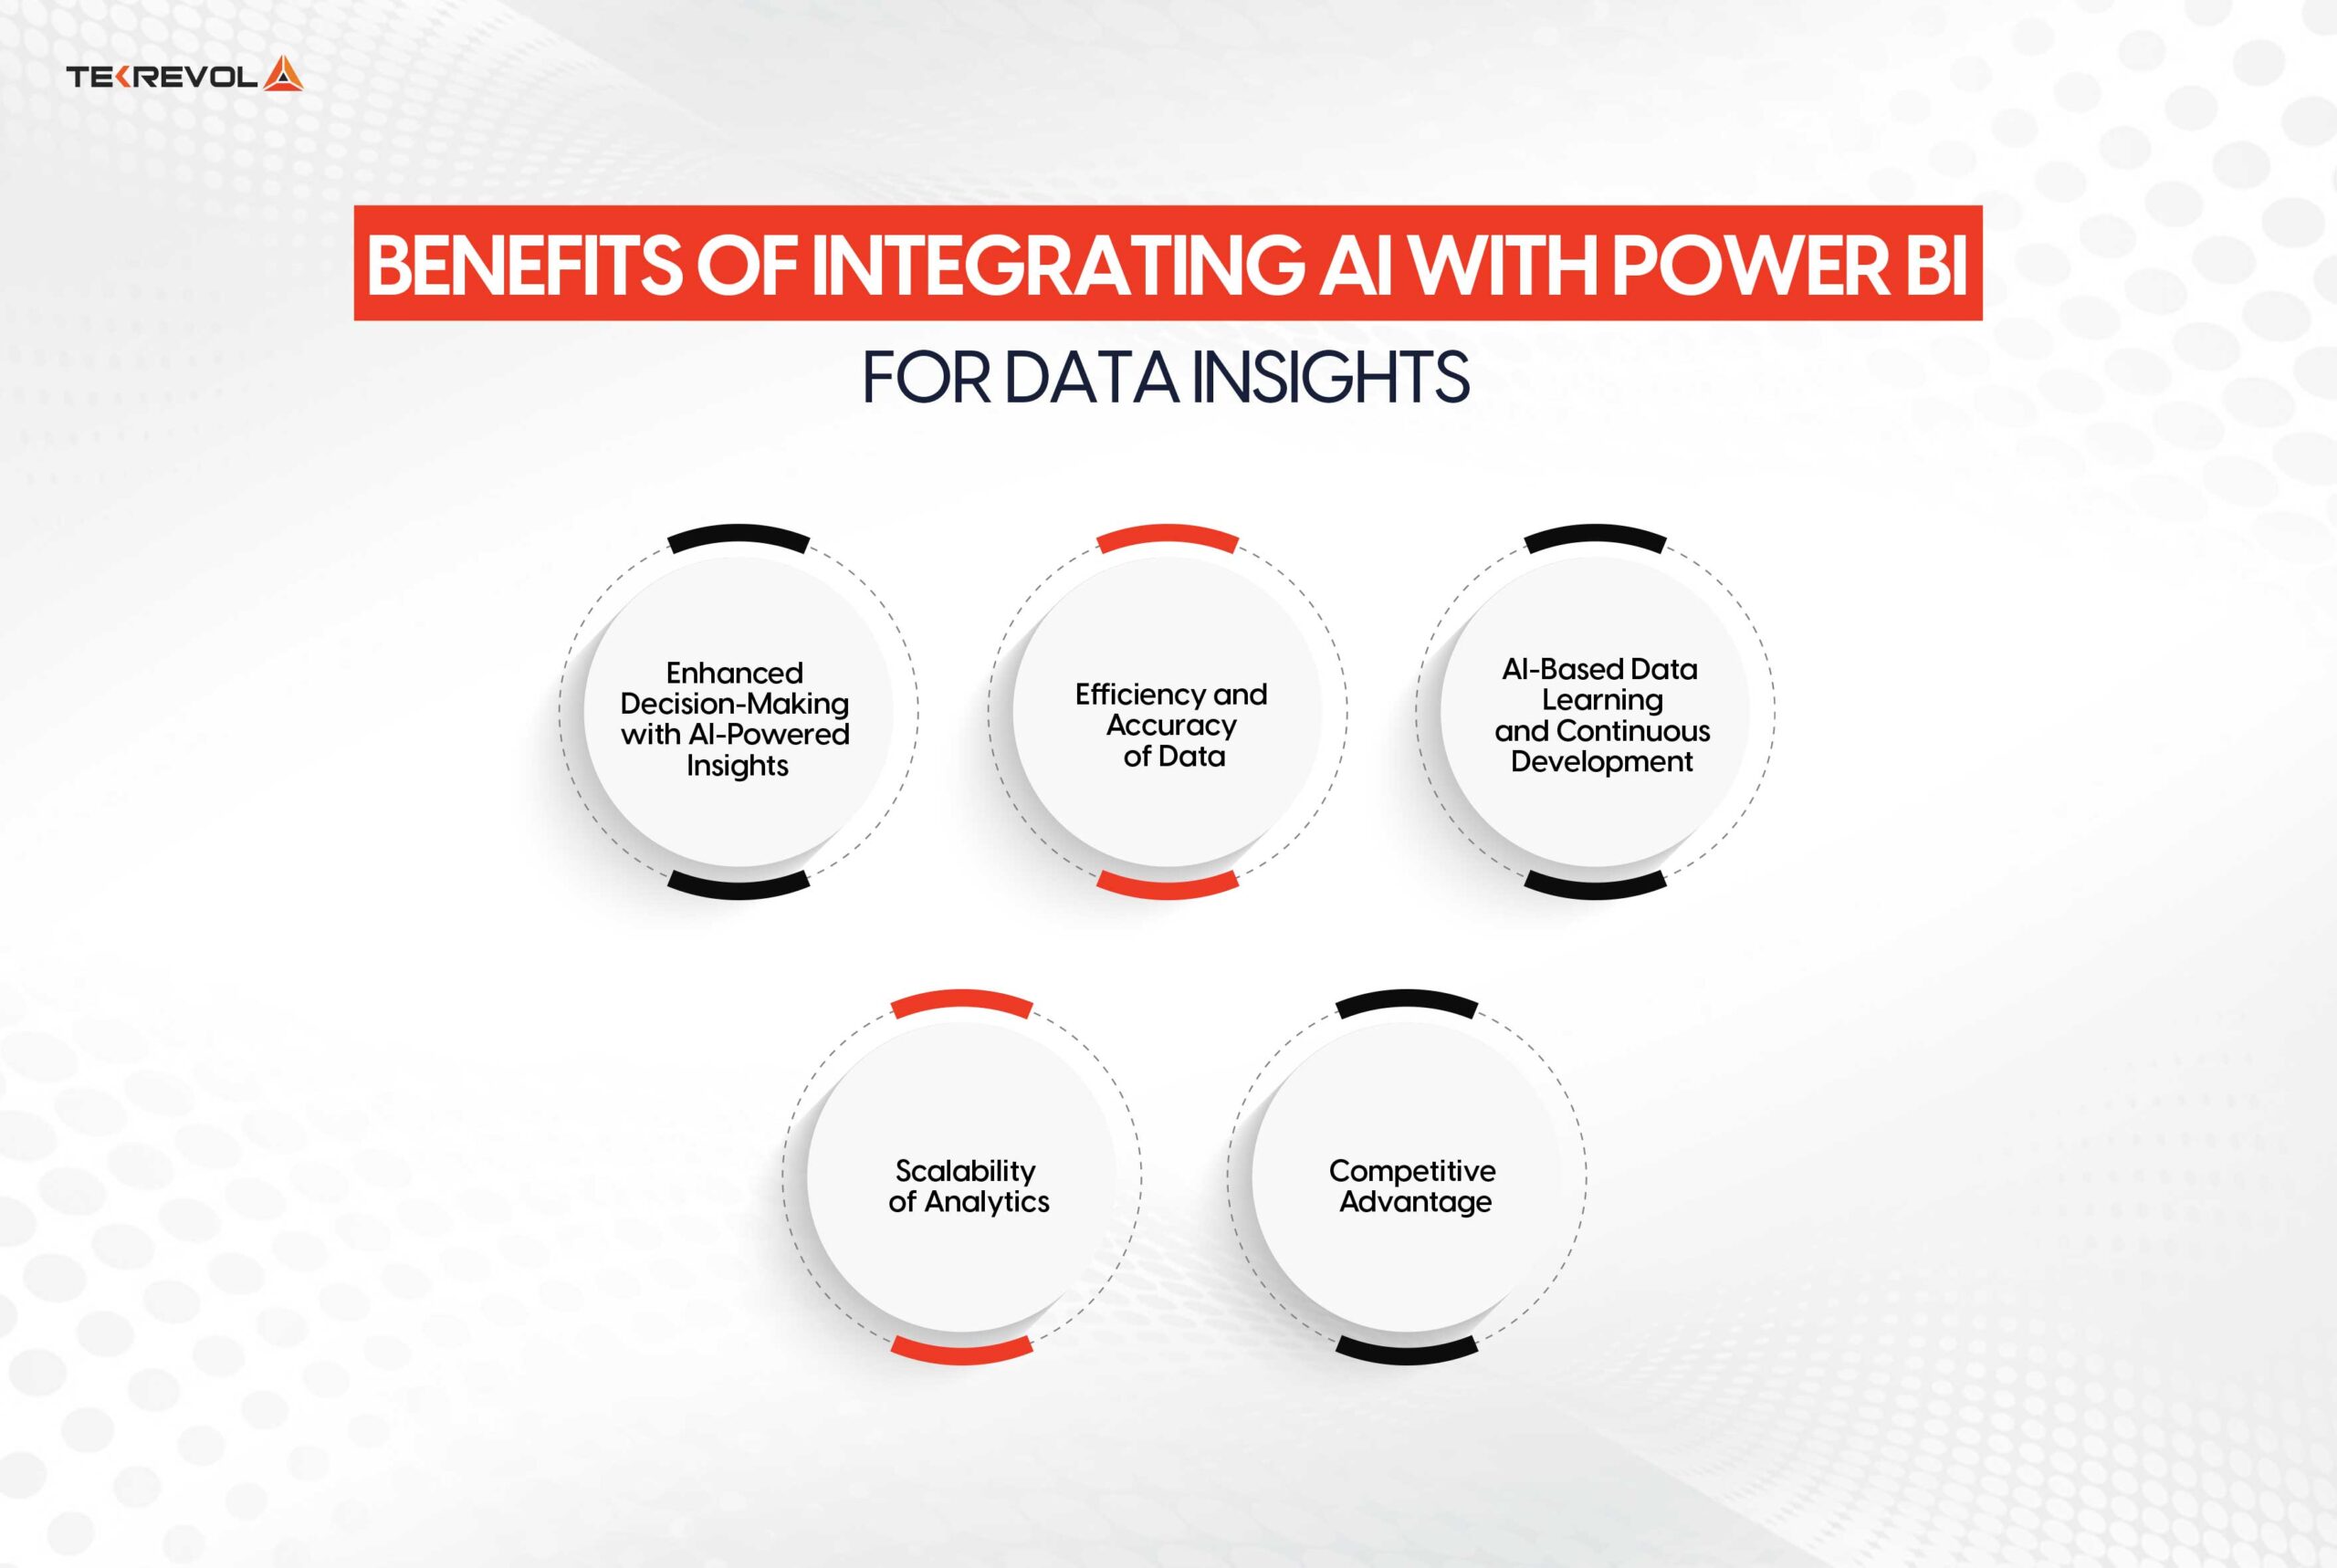
Studies reveal that 80% of executives expect AI to have a significant impact on their businesses, but less than half believe they possess the necessary capabilities to harness its benefits.
This gap highlights the need for better tools, such as Power BI AI integration, to bridge this divide. By integrating AI into your analytical processes, you can unlock numerous advantages that drive business growth and efficiency.
Enhanced Decision-Making with AI-Powered Insights
Organizations will make faster and better decisions based on the right information, bringing them specific needs. According to a study, companies using these insights improve their decision-making speed by 20% to react to the changes in the markets.
Efficiency and Accuracy of Data
Automating the process of data analysis reduces the possibility of human error and increases the speed with which analyzes are obtained. Businesses claim to have increased analytical efficiency by up to 25% after installing these systems, thus freeing up teams from data management and making them focus more on strategic initiatives.
AI-Based Data Learning and Continuous Development
Machine learning models keep improving with each new data input, thus refining their output with time. Firms using this functionality remain competitive as their results progressively become more accurate.
Scalability of Analytics
AI for analytics in Power BI empowers companies to process larger volumes of data and perform even complex analytics at no cost to performance. Growing organizations can then scale the analytics effort easily, adapting to new challenges and opportunities.
Competitive Advantage
Using AI with Power BI for predictive analytics gives a strategic lead over competition. Firms that embrace the use of these technologies leave those who do not by an extra 30% more out in front than those who do not, positioning them as market leaders.
By incorporating AI-powered Power BI insights into your business intelligence strategy, you can unlock all the power from your data and drive impactful results.
- Transform Your Business with Actionable Insights!
- Partner with us to leverage the power of Power BI intelligent insights through AI for strategic growth.
Best Practices For Integrating AI With Power BI
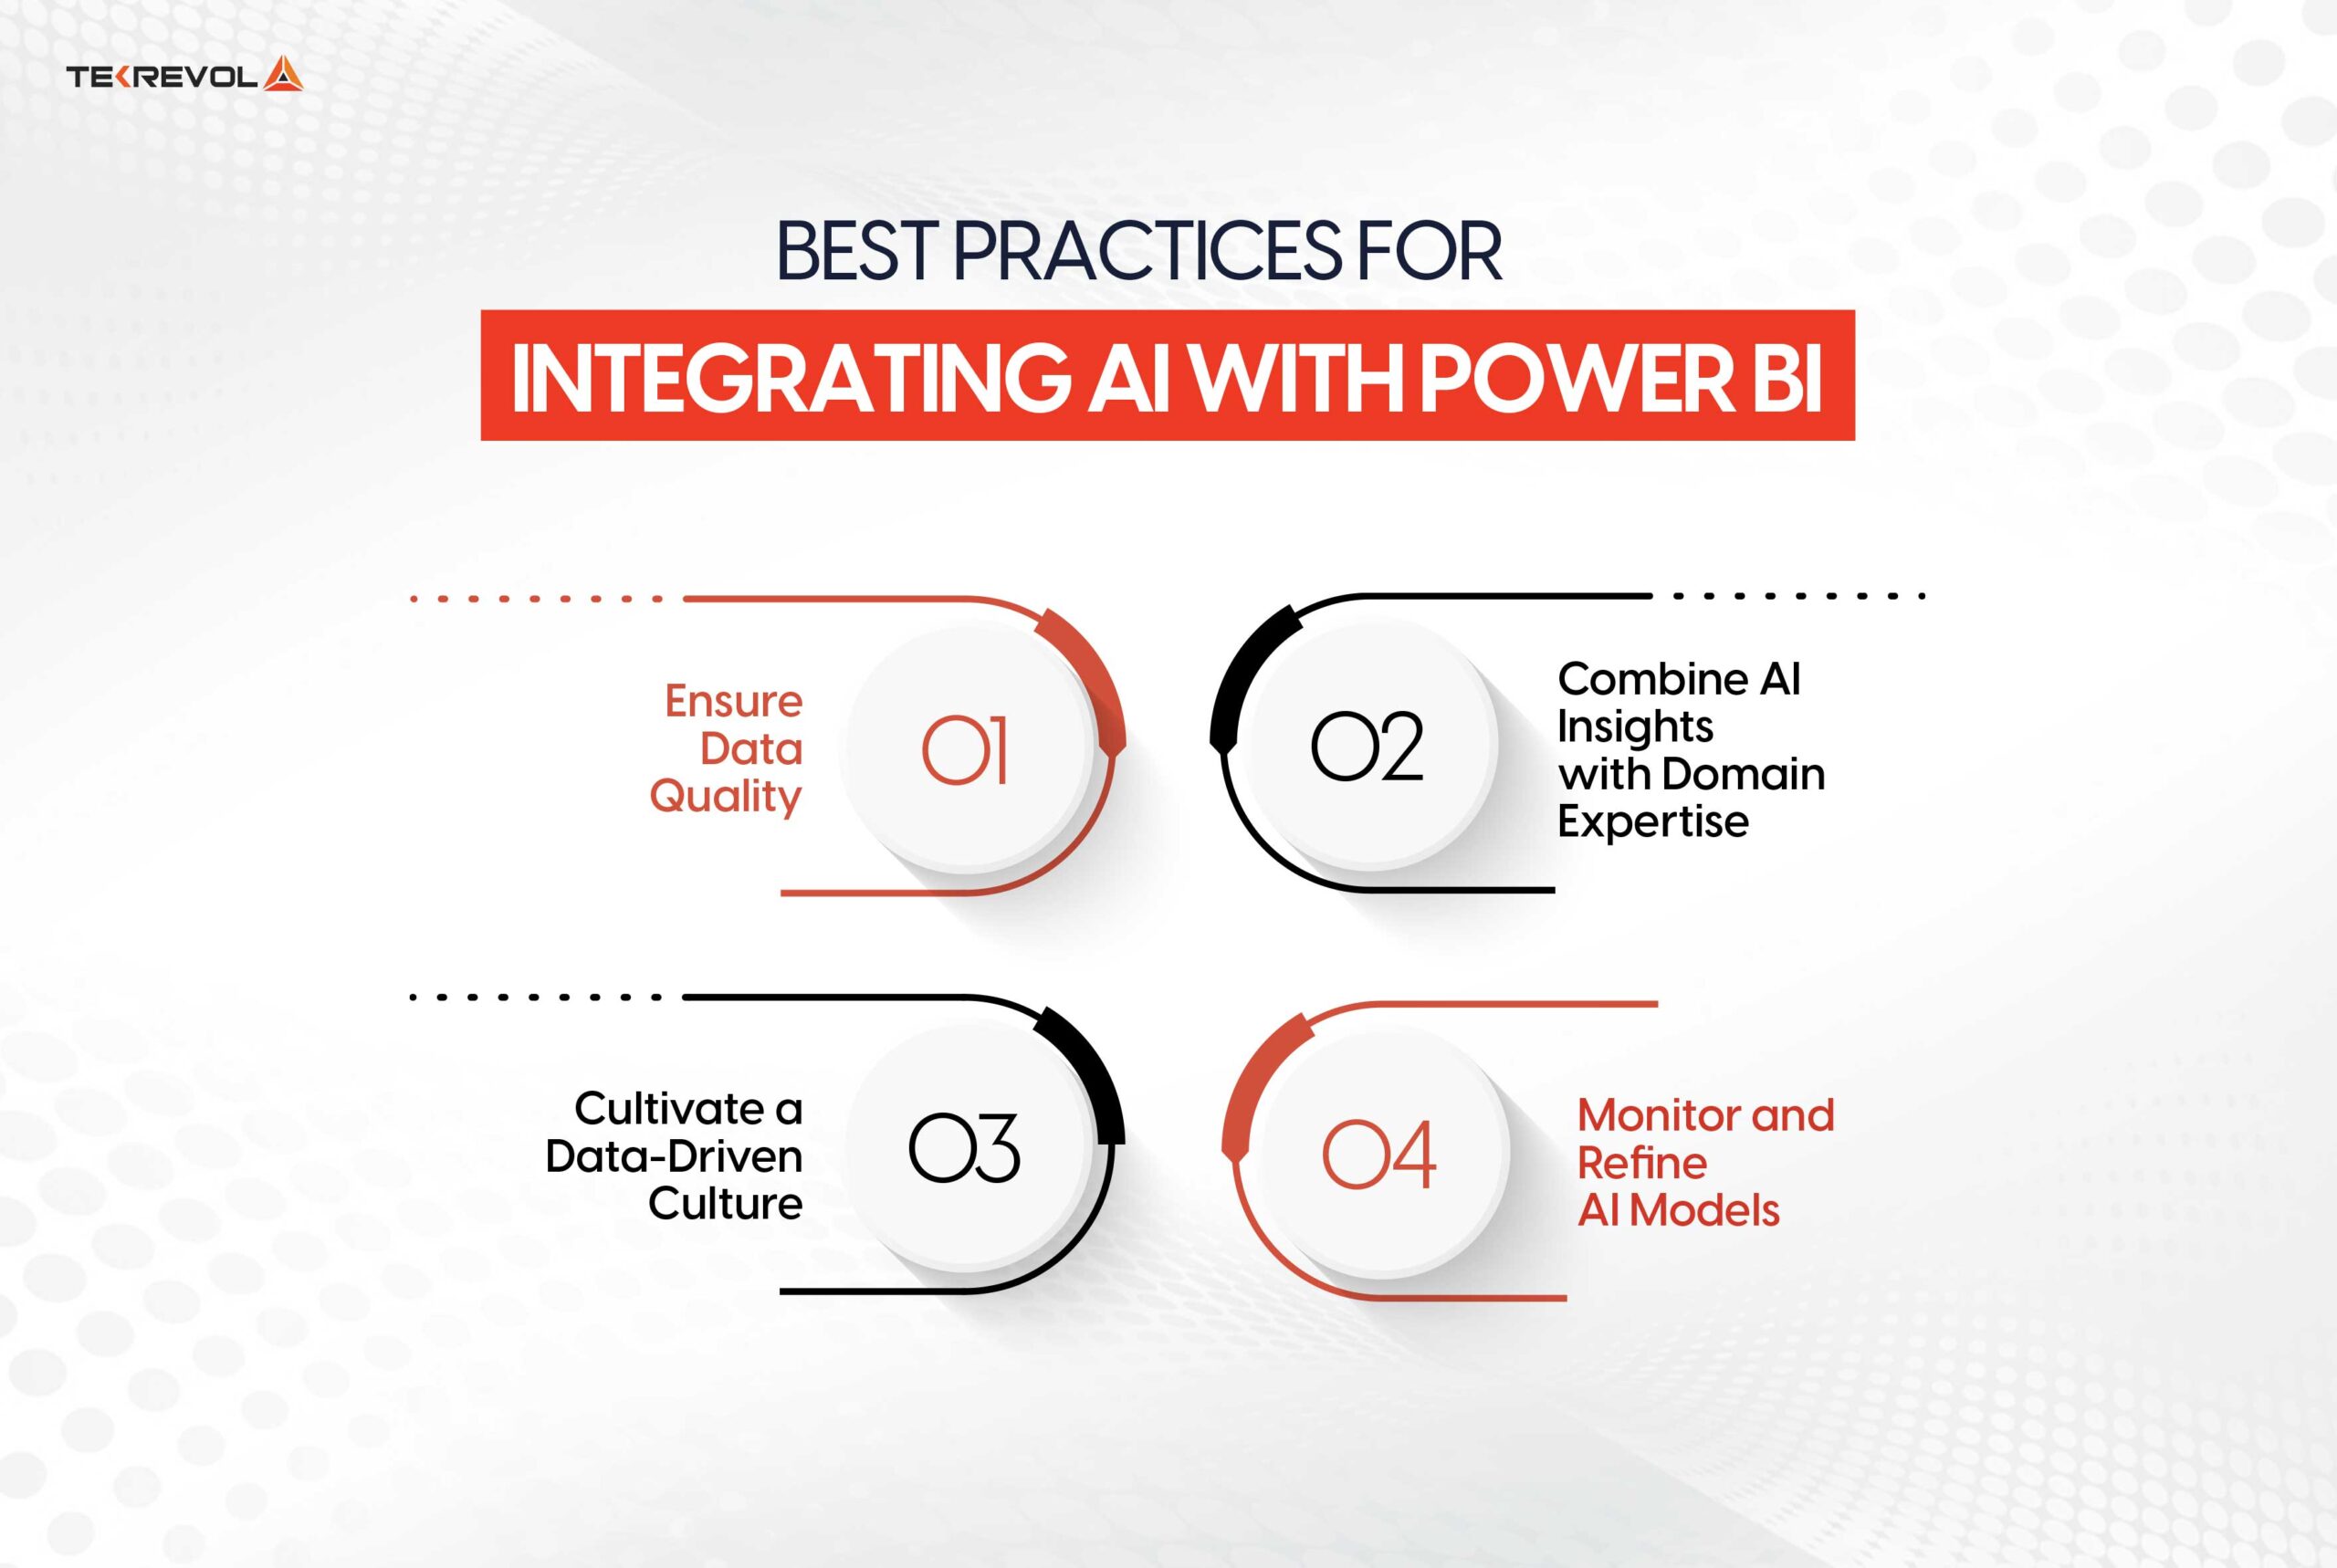
Implementing AI with Power BI can greatly amplify your data analysis, which will further lead to more profound business decisions. Consider these best practices to maximize the benefits of implementing AI with Power BI:
-
Ensure Data Quality
The essence of quality insights through AI is high-quality data. Maintain data integrity through the following practices.
- Data cleansing. Determine and rectify inaccuracies, inconsistencies, and missing values in your datasets.
- Clean the Data. Ensure that all data from various sources must be formatted uniformly by placing standard formats on them.
- Implement validation processes. Ensure that the data available is correct and relevant to analysis.
By focusing on data quality, you ultimately allow for more reliable and actionable insights from AI-driven Power BI.
-
Combine AI Insights with Domain Expertise
While AI provides powerful analytical capabilities, human expertise remains crucial. To effectively interpret AI-generated insights, encourage cross-functional collaboration among teams from various departments.
This approach combines technical analysis with business context, leading to more nuanced and applicable business insights. Additionally, staying updated on AI advancements and industry trends enhances your understanding and application of AI in Power BI.
-
Cultivate a Data-Driven Culture
Data-driven culture increases the efficiency of AI adoption. To create this culture:
- Leadership Commitment: Leaders can enforce and embrace data-informed decisions.
- Employee Training: Employee training is conducted to enhance the data literacy of the entire organization.
- Accessible Data: The appropriate data is accessible to whomsoever it may concern.
A robust data-driven culture enables your employees to use AI-powered insights in Power BI effectively.
-
Monitor and Refine AI Models
AI models need constant monitoring to remain effective. Ongoing performance reviews help evaluate model outputs and areas for improvement. Continuous updating of data keeps the model current and accurate, while adjustment for business change helps to reflect such changes in strategy or market conditions.
Implement these best practices in your organization, and one will be able to reap the true gains of its integration of AI with Power BI, bringing more insightful analysis for business growth strategies.
Final Word
Data is the new oil. Integrating AI with Power BI will transform data analysis in unprecedented ways, delivering deeper insights and much better-informed decision-making. Businesses can unlock new opportunities through growth and efficiency by exploring the AI features within Power BI.
If you want to make the most out of your business data with tailored solutions, contact us and partner with TekRevol for premium AI development services and maximize the benefits of AI-powered BI integration.
- Take Control of Your Data Today!
- Partner with us to harness the full capabilities of Power BI AI integration to turn your data into a strategic asset.

 1598 Views
 November 26, 2024