349 Views
 April 11, 2025
Over 6.3m apps are downloaded daily! Find out which countries & categories dominate mobile app download statistics and the $935B app economy.
Mobile App Download Statistics & Usage Statistics in 2025
An average person spends around 4.9 hours per day on their phone.
Out of that time, 89% is spent on mobile apps scrolling, shopping, streaming, and more.
Mobile apps are not just a leisure thing, they are the foundations of million-dollar business empires.
But here’s the catch: For businesses to succeed in this app-driven world, two things matter most:
- Getting your app discovered in crowded app stores.
- Convincing users to download and keep using it.
But it is not that simple and straight job.
It’s 2025 and the mobile app industry isn’t just growing, it’s exploding.
Since 2020, global app download statistics have surged by 65%, with over 299 billion downloads expected in 2025 alone.
For developers and marketers, understanding these numbers isn’t optional. It’s survival. It’s a matter of life and death (business-wise).
Why? Because app usage patterns reveal what users love, what they ignore, and where the money flows. How many apps are downloaded daily?
What makes some apps go viral while others flop? And how can you turn these insights into profit?
Stick around. We’ve packed this guide with jaw-dropping stats, actionable trends, and answers to every question you’ve got about mobile apps in 2025.
Let’s get started.
Key Mobile App Statistics for 2025
Below are some of the most crucial insights shaping the market in 2025:
- Google Play Store currently hosts 2.87 million apps, making it the largest app marketplace.
- Apple App Store has 1.96 million apps available for users to download.
- In 2024, over 137.8 billion apps and games were downloaded globally, and this number is expected to grow in 2025.
- Mobile apps generated over $935 billion in revenue in 2024, highlighting the industry’s profitability.
- Consumer spending on mobile apps is projected to reach $150 billion in 2025.
- 49% of people open an app 11+ times per day, showcasing high app usage engagement.
- 21% of Millennials open an app 50+ times daily, making them one of the most active user groups.
- 70% of all US digital media time comes from mobile apps, proving their dominance over desktop browsing.
- The average smartphone user interacts with 10 different apps daily and 30 apps per month.
- The global mobile app market size is projected to exceed $1 trillion by 2026.
- Gaming apps dominate the app industry, accounting for 56% of total downloads.
- Subscription-based apps have grown significantly, contributing to nearly 40% of app revenue.
- Social media and entertainment apps account for over 40% of total mobile app usage.
- The number of Android app downloads has surged, with billions of apps downloaded annually.
- The average app growth rate is expected to increase by 8-10% annually.
- Struggling to boost your app's performance?
- Let's analyze your current strategy and identify areas for improvement to enhance user engagement and revenue.
Global Mobile App Download Trends
The app download statistics for 2025 are staggering.
Mobile apps are projected to reach 299 billion downloads worldwide, up from 257 billion in 2023. That’s an 8% Compound Annual Growth Rate (CAGR).
Let’s delve deeper into these projections:
Global App Download Projections (2023–2027)
| Year | Global Downloads (Billion) | YoY Growth | Key Triggers |
| 2023 | 257 | 6% | Post-pandemic recovery |
| 2024 | 277 | 7.8% | 5G rollout in 50+ countries |
| 2025 | 299 | 8% | Emerging market smartphone boom |
| 2026 | 324 | 8.4% | Increased adoption of mobile-first services |
| 2027 | 350 | 8% | Expansion of IoT and smart devices integration |
Source: Sensor Tower, 2025 Global App Market Report
What’s Fueling This Growth?
Smartphone Adoption:
- Global Reach: By 2025, 5.3 billion people, accounting for 83% of the global population, are expected to own smartphones.
- India’s Surge: In 2024, India added 120 million new smartphone users, reflecting a significant uptick in mobile penetration.
Affordable Data:
- Cost Efficiency: In countries like Nigeria, the cost of 1GB of data has plummeted to $0.50, making mobile internet more accessible and driving app usage.
5G Expansion:
- Global Rollout: Over 75 countries have launched 5G networks, enhancing capabilities for high-definition streaming and augmented reality (AR) gaming experiences.
Why This Matters:
For every 1,000 apps launched, only one gains significant traction. Standing out in this crowded marketplace necessitates a deep understanding of current trends and user behaviors.
How Many Apps Are Downloaded Daily
Breaking down the annual projection, 299 billion downloads in 2025 translate to approximately 819 million daily downloads.
However, daily averages can mask significant fluctuations influenced by events and seasons:
Event-Driven Download Spikes:
- Black Friday: Daily downloads can surge to 1.5 billion, with top apps including Amazon, Temu, and Shein.
- Christmas Day: Downloads may reach 1.3 billion, favoring entertainment apps like Netflix, Disney+, and various mobile games.
- Major Game Launches: Anticipated releases such as “Genshin Impact” and “Call of Duty” can drive daily downloads up to 1.1 billion.
Peak Download Times:
- Evening Hours (7–10 PM): This window accounts for 40% of daily downloads, as users engage with their devices after work or school.
- Weekends: Download activity tends to be 25% higher compared to weekdays, reflecting increased leisure time.
Pro Tip: Aligning app launches with holiday seasons or major events can double visibility and user engagement.
Free vs. Paid Downloads
While free apps dominate the market, paid apps have carved out profitable niches.
Here’s a comparative overview:
Free vs. Paid App Metrics:
| Metric | Free Apps | Paid Apps |
| % of Total Downloads | 98% | 2% |
| Top Categories | Social, Gaming | Productivity, Design |
| Avg. Revenue/User | $0.80 (primarily from ads) | $4.50 (mainly from subscriptions) |
| Day 30 Retention | 12% | 22% |
| User Lifetime Value | $5.20 | $45.00 |
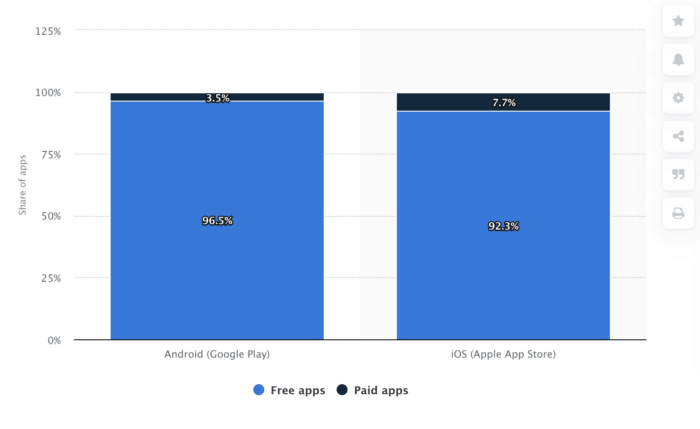
Source: Statista
Notable Examples:
- TikTok: A free app that generated $18 billion from advertising revenue in 2024.
- Procreate Pocket: A one-time purchase app priced at $5, boasting over 2 million paid users.
- Notion: Operates on a freemium model, earning $10 million monthly from premium subscriptions.
Emerging Trend: Approximately 45% of paid apps now offer 7-day free trials to attract and retain users.
App Downloads by Country: Top 10 Leaders
The global app market exhibits significant regional variations.
Here’s how the top 10 countries are projected to perform in 2025:
Top Countries by App Downloads:
| Rank | Country | 2025 Downloads (Billion) | Growth vs. 2023 | Top Categories |
| 1 | India | 78 | +18% | Gaming, Fintech, Social |
| 2 | China | 72 | +6% | Super-Apps, E-commerce |
| 3 | USA | 38 | +4% | Streaming, Fitness, Productivity |
| 4 | Brazil | 30 | +22% | Social, Shopping |
| 5 | Indonesia | 22 | +15% | Gaming, Ride-Sharing |
| 6 | Nigeria | 18 | +320% | Fintech, Betting |
| 7 | Russia | 16 | +8% | Gaming, Utilities |
| 8 | Mexico | 14 | +12% | Social, Entertainment |
| 9 | Japan | 12 | +3% | Anime, Productivity |
| 10 | Vietnam | 10 | +45% | Social, Gaming |
Source: Sensor Tower, 2025 Global App Market Report
Key Insights:
- India’s Dominance: With over 800 million smartphone users and data plans as low as $0.10/GB, India leads in app downloads.
- Nigeria’s Surge: Nigeria is one of the fastest-growing mobile app markets, with fintech apps driving a 320% increase in downloads between 2023 and 2025.
Platforms like Opay and Flutterwave have seen exponential growth, providing financial services to millions who previously lacked access to traditional banking.
Betting apps like SportyBet and BetKing also contribute significantly, accounting for 25% of total app downloads in the country.
- Ready to dominate the app stores?
- Partner with a leading mobile app development company to develop a tailored plan that propels your app to the top of the charts.
The future of mobile app downloads is being shaped by emerging markets in Africa and Southeast Asia. These regions are experiencing massive growth due to:
- Cheap Smartphones: The rise of $50 Android phones from brands like Transsion (Tecno, Infinix) has made smartphone ownership more accessible.
- Low-Cost Data Plans: Internet access is becoming more affordable, with monthly data costs as low as $1 in some regions.
- Localized Content: Apps tailored to regional languages and cultures (e.g., Hindi, Tagalog, Vietnamese) are seeing rapid adoption.
Breakdown of Fastest-Growing App Markets (2025):
| Country | YoY Download Growth | Key App Categories |
| Nigeria | +320% | Fintech, Betting |
| Vietnam | +55% | Social, E-commerce |
| Philippines | +180% | Shopping, Mobile Payments |
| Egypt | +200% | Streaming, Ride-hailing |
| Pakistan | +150% | Gaming, EdTech |
App Categories Driving Growth: Top 10 for 2025
Not all apps grow equally. The fastest-growing categories highlight changing consumer behavior.
| Rank | Category | % of Total Downloads | Top Apps |
| 1 | Gaming | 25% | Roblox, Stumble Guys |
| 2 | Social Media | 20% | TikTok, Instagram |
| 3 | E-commerce | 18% | Temu, Shein |
| 4 | Health & Fitness | 15% | MyFitnessPal, Freeletics |
| 5 | Fintech | 12% | PayPal, Venmo |
| 6 | Education | 10% | Duolingo, Khan Academy |
| 7 | Streaming | 9% | Netflix, Spotify |
| 8 | Productivity | 8% | Notion, Slack |
| 9 | Travel | 6% | Airbnb, Booking.com |
| 10 | Food Delivery | 5% | Uber Eats, Zomato |
Furthermore, here is the distribution of app downloads worldwide between 2023 and 2024, by category:
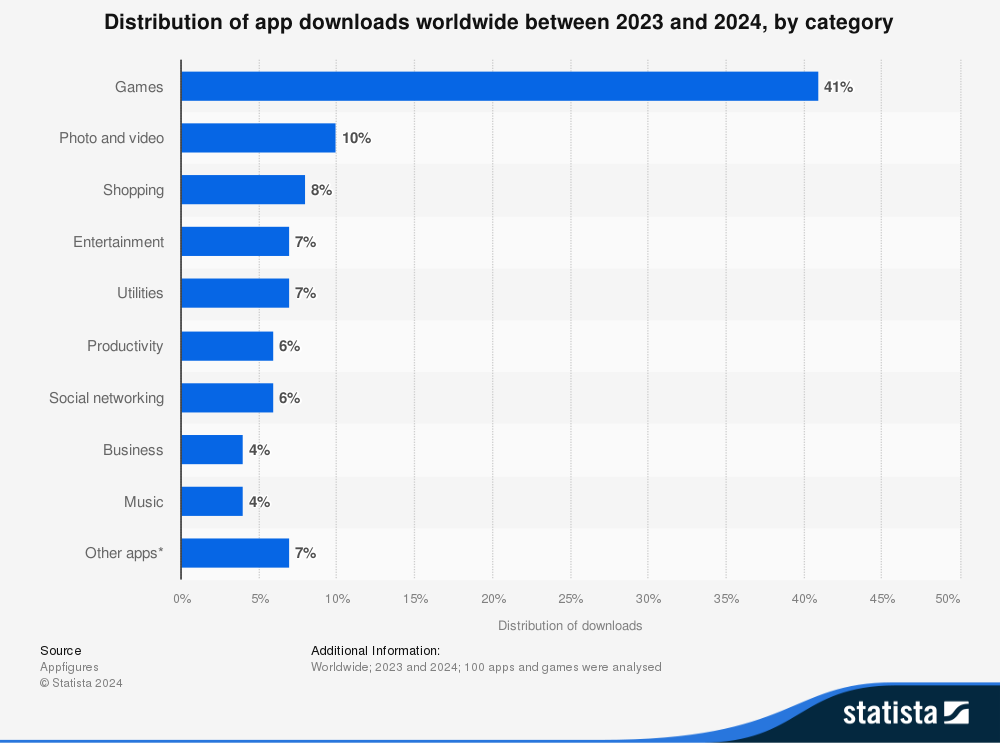
Source: Statista
Retention vs. Downloads: The Hidden Struggle
High app download stats don’t always translate into long-term success. Many apps struggle with user retention, leading to high churn rates.
| Metric | Gaming Apps | Fintech Apps | Social Apps |
| Day 1 Retention | 28% | 35% | 40% |
| Day 7 Retention | 8% | 20% | 25% |
| Day 30 Retention | 5% | 12% | 15% |
Strategies to Improve Retention:
- Push Notifications: Apps using AI-driven personalized push alerts see a 2.5x improvement in retention (Source: Localytics).
- Reward Systems: Duolingo’s streak feature has boosted 30-day retention by 22%.
- Referral Bonuses: Dropbox increased signups by 60% using referral programs.
Regional Preferences: What’s Hot Where
Cultural preferences play a significant role in app usage statistics across different regions.
-
India:
-
-
- Vernacular Apps: ShareChat (regional social media) has hit 200 million active users.
- Cricket Apps: FanCode streams live cricket to 50M+ users.
-
-
Middle East:
-
-
- Ramadan Apps: Apps like Athan Pro see a 90% spike in downloads during Ramadan.
-
-
Japan:
-
- Anime Apps: Crunchyroll and AbemaTV account for 80% of anime streaming time.
Android vs. iOS: The Platform Divide
The competition between Android and iOS continues, with significant differences in downloads and revenue.
| Metric | Android | iOS |
| % of Downloads | 75% | 25% |
| Avg. Revenue/User | $38 | $101 |
| Top Markets | India, Nigeria | USA, Japan |
Why iOS Generates More Revenue:
- High Disposable Income: 60% of iOS users earn $75K+ per year.
- Subscription Model: 45% of iOS users pay for apps like YouTube Premium and Apple Music.
How Many Apps Are Released Daily?
The mobile app industry is still expanding, but competition is fierce.
- New Apps Released Daily: 5,500 apps are launched each day, totaling 2 million new apps per year.
- Most Crowded Category: Gaming, accounting for 25% of all apps.
- Saturation Reality: 60% of apps are deleted within 30 days.
How to Succeed in 2025:
- Find a Niche: Hyper-specific apps like “Plant Parent” (for gardeners) have seen 300% YoY growth.
- Follow Emerging Trends: AI-powered apps, such as ChatGPT-integrated fitness trainers, grew 35% YoY.
- Leverage Viral Growth: Social commerce apps like TikTok Shop have increased Gen Z adoption by 45%.
- Want to turn your app into a profit machine?
- Discover monetization strategies from TekRevol experts that align with your goals and maximize your app's revenue potential.
Platform Wars: Apple App Store vs. Google Play Store
Source: Statista
The competition between Apple’s App Store and Google’s Play Store extends beyond mere download numbers; it encompasses user demographics, revenue models, and global influence.
While Google Play leads in total downloads, the App Store excels in revenue per user, highlighting a contrast between quantity and quality.
Key Stats (March 2025)
| Metric | Google Play Store | Apple App Store |
| Total Downloads | 139B (31% YoY growth) | 34.3B (4% YoY growth) |
| Revenue (2024) | $46.7B | $103.4B |
| Revenue (2025) | $78B (est.) | $123B (est.) |
| Apps Available | 2.06M | 3.84M |
| Avg. Revenue Per User | $38 | $101 |
| New Apps Added Daily | 1,205 | 950 |
| Active Developers | 580,876 | 1.2M+ |
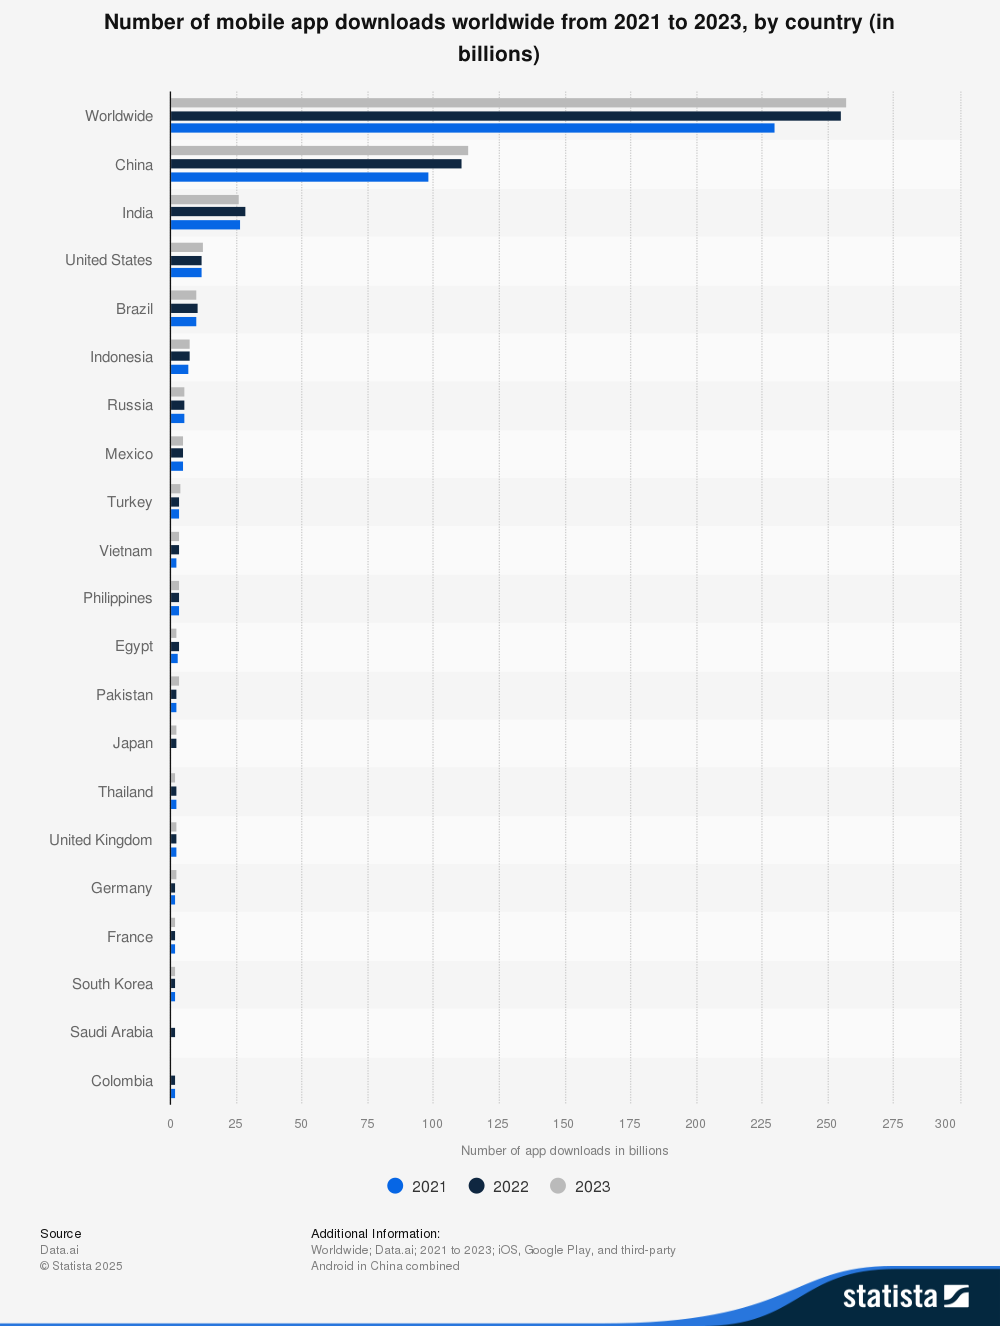
Google Play Store in 2025: The Volume King
-
Availability & Downloads
-
- Total Apps: 2.06 million, up from 1.56 million in 2024.
- New Apps Added Daily: Approximately 1,205, with a focus on utility tools and localized applications.
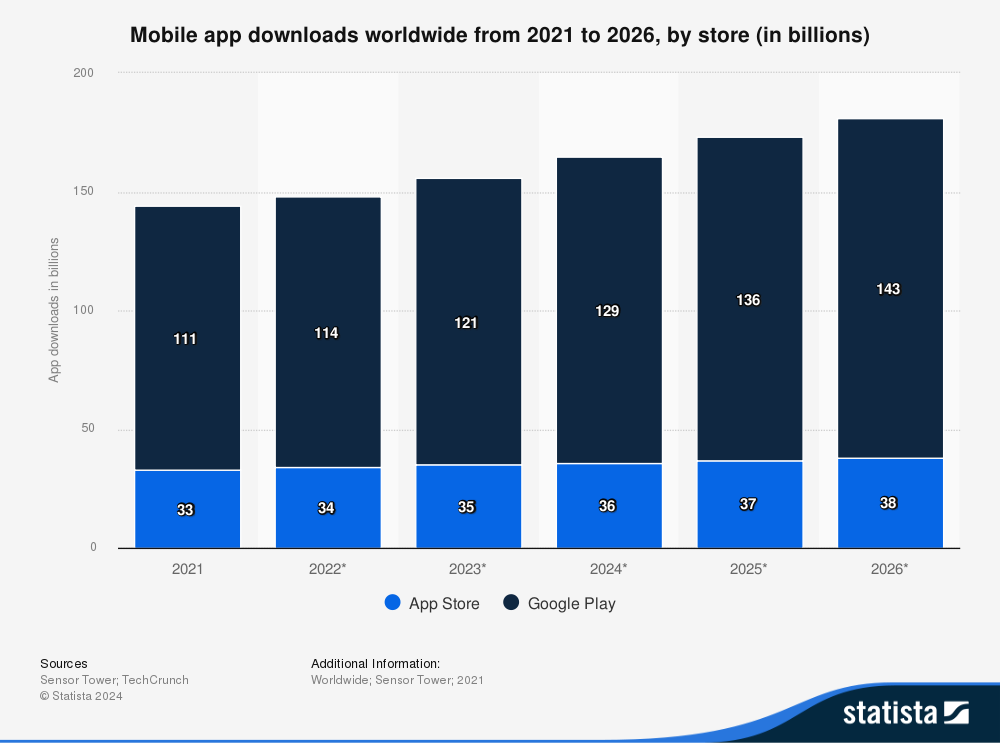
- 2025 Downloads: 139 billion, marking a 31% year-over-year growth.
- Top Contributing Countries: India, Brazil, and Indonesia, collectively accounting for 28.3 billion new installs in 2024.
- Projection: Expected to reach 143 billion downloads by 2026, up from 111 billion in 2021.
Source: Statista
-
Developer Ecosystem
-
-
- Active Developers: 580,876 actively publishing on Google Play.
- Independent Developers: 65% are indie developers or small studios targeting emerging markets.
- Top Niches:
- Education: 162,033 apps.
- Tools: 91,029 apps.
- Gaming: 78,450 apps.
-
-
Most Popular Categories
| Rank | Category | % of Apps | Top Apps |
| 1 | Tools | 13.8% | WhatsApp, SHAREit |
| 2 | Education | 10.47% | Duolingo, Khan Academy |
| 3 | Entertainment | 8.44% | YouTube, MX Player |
| 4 | Business | 6.96% | Zoom, Slack |
| 5 | Gaming | 6.5% | Free Fire, Candy Crush |
-
Reasons for Dominance:
-
-
- Tools: Often pre-installed on 95% of Android devices, including file managers and cleaners.
- Education: Experienced a 45% surge post-pandemic, especially in countries like India and Nigeria.
-
-
Revenue Drivers
-
- Advertisements: Constitute 55% of revenue ($26B in 2024), with significant contributions from apps like TikTok and YouTube.
- In-App Purchases: Account for 30% of revenue, predominantly from gaming apps such as Free Fire, which generated $2.4B in 2024.
Apple App Store in 2025: The Revenue Powerhouse
-
Availability & Downloads
-
-
- Total Apps: 3.84 million, including over 1 million games.
- Premium Apps: Over 16,000 apps priced between $1–$2, targeting premium users.
- 2025 Downloads: 34.3 billion, reflecting a 4% year-over-year growth.
- Leading Categories: Productivity and health apps led the 9.1 billion new installs in 2024.
-
-
Developer Ecosystem
-
- Total Developers: Over 1.2 million, including 75% of Fortune 500 companies.
- Top Niches:
- Gaming: 11.86% of apps.
- Business: 10.35%.
- Education: 9.8%.
3. Most Popular Categories
| Rank | Category | % of Apps | Top Apps |
| 1 | Games | 11.86% | Roblox, Among Us |
| 2 | Business | 10.35% | Notion, Microsoft Teams |
| 3 | Education | 9.8% | Coursera, Quizlet |
| 4 | Entertainment | 5.72% | Netflix, Disney+ |
| 5 | Health | 3.9% | MyFitnessPal, Calm |
-
Reasons for Dominance:
-
-
- Gaming: iOS users spend three times more than Android gamers ($120 vs. $38 per year).
- Business Apps: The hybrid work trend has boosted tools like Zoom, which surpassed 180 million downloads.
-
-
Revenue Drivers
-
- Subscriptions: Make up 50% of revenue ($61.7B in 2024), with major contributions from platforms like Netflix and Disney+.
- One-Time Purchases: Account for 30% of revenue, with apps like Procreate offering a $5 one-time fee.
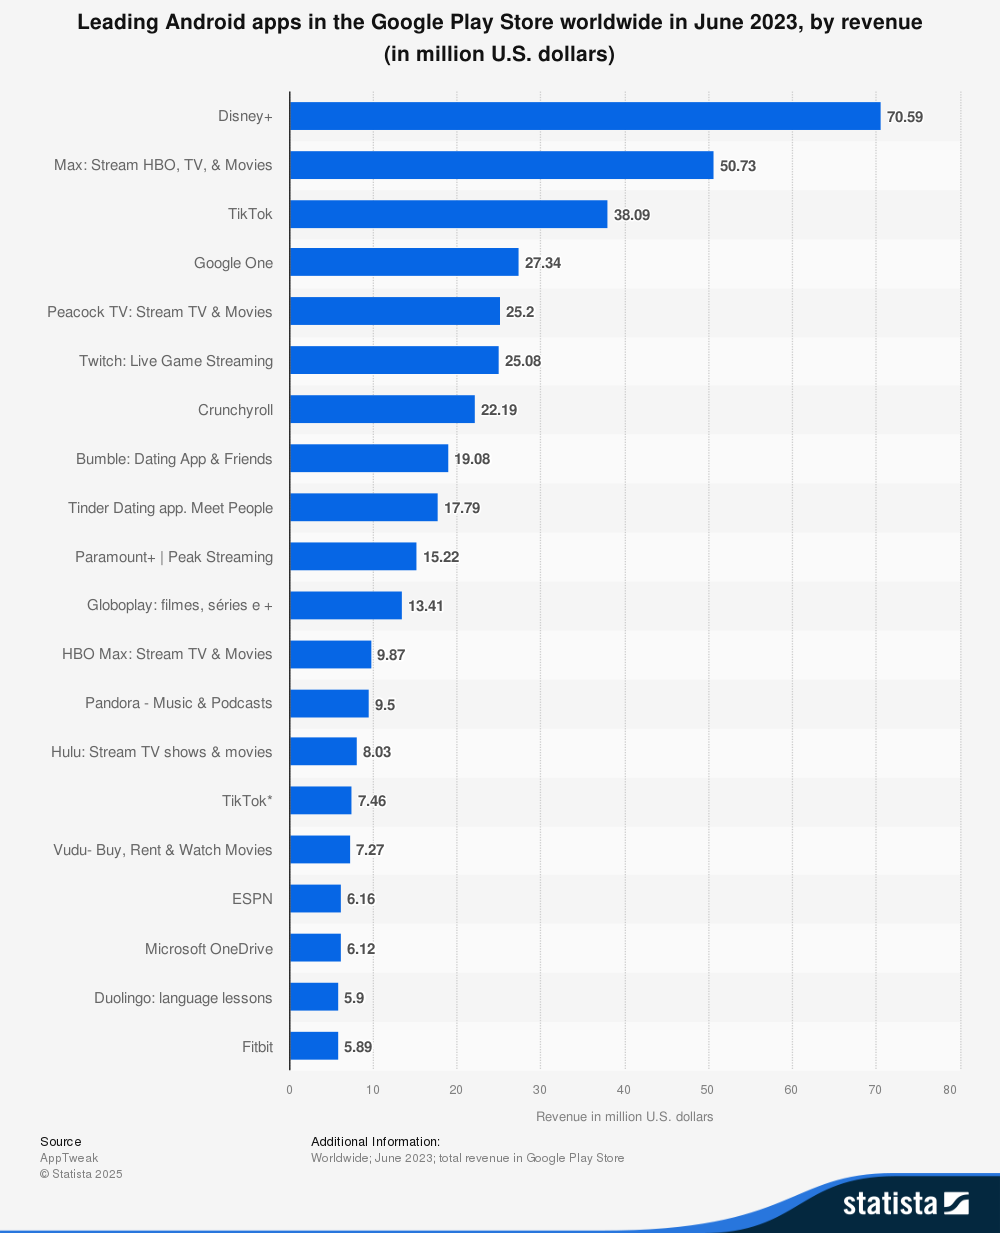
Most Downloaded Apps in 2025
In 2025, the app landscape showcased significant shifts, with certain applications leading in global downloads across both the Apple App Store and Google Play Store.
Below is a table highlighting the top five most downloaded apps worldwide:
| Rank | Application | Total Downloads (2025) | Usage |
| 1 | 48 million | A photo and video-sharing social networking service owned by Meta Platforms. | |
| 2 | TikTok | 45 million | A short-form video hosting service owned by ByteDance. |
| 3 | 38 million | A cross-platform messaging and Voice over IP service owned by Meta Platforms. | |
| 4 | 37 million | A social networking service also owned by Meta Platforms. | |
| 5 | ChatGPT | 31 million | An AI language model developed by OpenAI, offering conversational AI services. |
Data sourced from Backlinko’s report on the most popular apps in December 2024.
- Is your app getting lost in the crowd?
- Learn how to stand out with effective marketing techniques that attract and retain users.
Emerging Trends Shaping 2025
-
AI Integration: Boom and Backlash
-
-
- Growth: Approximately 35% of new apps incorporated AI features, including AI tutors and photo editors.
- Example: Lensa AI achieved 50 million downloads in 2024 but faced criticism for its $200/year subscription model.
- Challenges: Around 40% of AI apps were accused of misleading marketing, prompting investigations by the European Union.
-
-
Regulatory Earthquakes
-
-
- Google: A U.S. federal judge mandated that Google allow third-party app stores on Android devices by 2026, potentially reducing Google Play Store revenue by $5 billion annually.
- Apple: The European Union warned Apple to cease geo-blocking apps, threatening fines up to $20 billion.
-
-
Alternative App Stores Rising
-
- Huawei AppGallery: Reached 650 million users in 2025, focusing on China and the Middle East and North Africa (MENA) regions.
- Samsung Galaxy Store: Pre-installed on 250 million devices, offering developers a 15% revenue cut.
Regional Dominance: Where Each Platform Wins
App Store Strongholds
| Region | % of Downloads | Key Drivers |
| USA | 35% | 55% iPhone adoption; $120/user annual spending |
| Japan | 12% | Preference for premium RPGs (e.g., Genshin Impact) |
| Western Europe | 25% | High 5G penetration (85% in Germany) |
Case Study – Japan
Japan remains one of Apple’s most profitable markets, with iOS users spending an average of $150 per year on gaming apps—the highest globally.
The dominance of role-playing games (RPGs) and subscription-based mobile games contributes to this high spending trend.
Google Play Strongholds
| Region | % of Downloads | Key Drivers |
| India | 30% | 800M+ Android users; ultra-cheap data ($0.10/GB) |
| Brazil | 15% | Social commerce boom (Shein, Shopee) |
| Indonesia | 12% | Mobile Legends drives 40% of downloads |
Case Study – India
India continues to lead in Google Play downloads, with 280 million+ app downloads in Q1 2025 alone.
The rapid adoption of affordable Android smartphones, coupled with some of the world’s cheapest mobile data plans, fuels the dominance of free-to-download apps in categories such as fintech, gaming, and e-commerce.
Strategic Takeaways for Developers
-
For Reach:
-
-
- Target Google Play in countries like India, Brazil, and Indonesia with low-cost, ad-supported apps.
- Incorporate localized content, such as regional languages like Hindi and Portuguese.
-
-
For Revenue:
-
-
- Prioritize the Apple App Store in markets like the U.S., Japan, and Western Europe with subscription-based models.
- Leverage Augmented Reality (AR) and Virtual Reality (VR) features; for instance, IKEA Place experienced a 30% growth utilizing AR.
-
-
Future-Proofing:
-
- Integrate AI ethically, avoiding deceptive pricing strategies.
- Prepare for the emergence of third-party app stores, such as those from Huawei and Samsung.
Mobile App Usage Statistics
Mobile apps continue to be a driving force in digital consumption, with global users spending more time and money on apps than ever before.
As of 2025, the average smartphone user spends 4.9 hours per day on mobile apps, up from 4.1 hours in 2023, accounting for nearly 35% of waking hours.
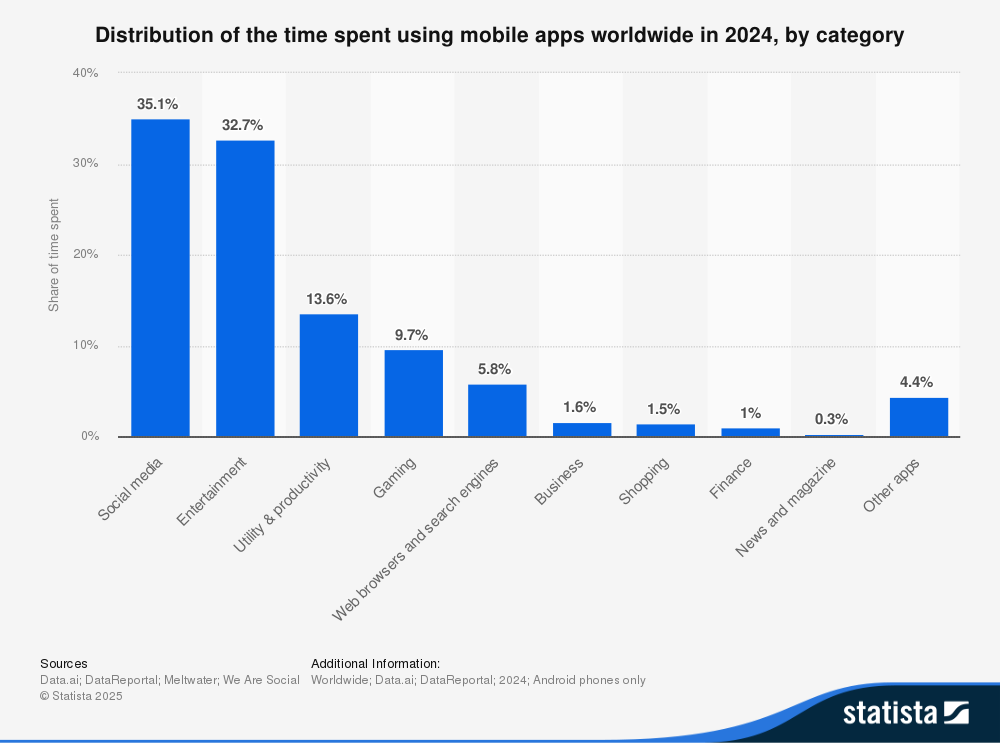
Source: Statitsa
This shift is fueled by several key trends:
- Short-form video addiction: TikTok and Instagram Reels have optimized AI algorithms that keep users engaged longer than ever.
- Seamless social commerce: In-app checkout and live shopping features are boosting mobile purchases.
- AI-driven recommendations: YouTube reports that 35% of total watch time now comes from AI-suggested content.
Daily App Usage Breakdown
| App Category | Time Spent (2025) | Top Apps |
| Social Media | 101 mins/user | TikTok, Instagram Reels |
| Streaming | 78 mins/user | YouTube, Netflix |
| Messaging | 55 mins/user | WhatsApp, Telegram |
| Gaming | 45 mins/user | Roblox, Free Fire |
| Shopping | 30 mins/user | Amazon, Temu |
Key Trends Driving App Engagement
- TikTok Dominance: Users now spend 1.7x more time on TikTok than Instagram, thanks to infinite scrolling and personalized feeds.
- AI-Powered Content: 35% of YouTube watch time comes from AI-generated recommendations.
- Shopping & Social Media Integration: TikTok Shop users spend 22 minutes daily browsing and purchasing products.
Mobile App Retention and Churn: The Silent Challenge
While downloads continue to rise, keeping users engaged is a challenge.
71% of users abandon apps within 90 days of downloading, making retention a top priority for developers.
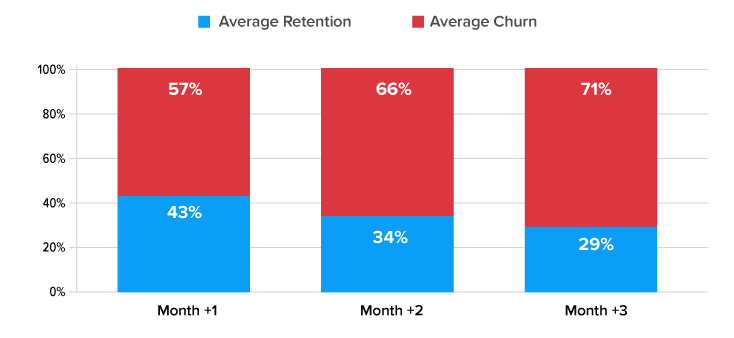
Source: Buildfire
App Retention Rates by Category
| App Type | Day 1 Retention | Day 30 Retention |
| Fitness | 35% | 12% |
| Gaming | 28% | 5% |
| E-commerce | 25% | 8% |
| Productivity | 40% | 15% |
Top Reasons for Churn
- Poor User Experience: 45% of users delete apps after a single crash.
- Hidden Costs: 30% quit due to unexpected subscriptions or paywalls.
- Cluttered Design: 25% abandon apps with confusing layouts or excessive ads.
Retention Strategies for Developers
- AI-Driven Push Notifications: Duolingo’s streak reminders have doubled retention rates.
- Freemium Models: Offering free trials with gradual paywalls increases conversion (e.g., Calm’s 7-day meditation trial).
Mobile App Engagement Across Age Groups
Age plays a crucial role in app usage patterns. While Gen Z dominates social media and gaming, older generations prioritize productivity and telehealth apps.
| Age Group | Daily Time Spent | Top App Categories |
| 18–24 | 5.2 hours | Social Media, Gaming, Streaming |
| 25–34 | 4.8 hours | Shopping, Fintech, Productivity |
| 35–44 | 3.5 hours | Parenting, News, Health |
| 45–54 | 2.7 hours | Travel, Recipes, Email |
| 55+ | 1.9 hours | Telehealth, Banking, Solitaire |
Notable Demographic Trends
- Gen Z addiction: 60% check TikTok within 5 minutes of waking up.
- Boomers & Telehealth: 40% use apps like Teladoc for virtual medical visits.
Gender and Income App Usage Patterns
Gender-Based Trends
- Women dominate social shopping: 60% of in-app purchases on Instagram Shops, Pinterest, and TikTok Shop are made by female users.
- Men engage more in gaming: 65% of gaming app revenue comes from male users, particularly in esports and competitive gaming.
Income-Based Spending Patterns
| Income Bracket | Subscription Adoption | Avg. Monthly App Spend |
| $75K+ | 65% | $24.50 |
| $50-75K | 42% | $14.80 |
| <$50K | 18% | $6.20 |
High-income users (top 20%) account for:
- 78% of all premium app purchases.
- 62% of productivity app subscriptions.
- 55% of cloud gaming spend.
Regional Analysis: Downloads and Usage by Country
Top Countries by Mobile App Downloads (2025)
| Country | Total Downloads | % Global Share | Top App Category |
| India | 75B | 25% | Fintech, Gaming |
| U.S. | 35B | 12% | Productivity, Health |
| Brazil | 28B | 9% | Social, Streaming |
| China | 62B | 21% | Super-Apps, Short Video |
| Indonesia | 18B | 6% | E-commerce, Ride-Hailing |
Cultural Influences on App Adoption
Regional App Preferences
- China: WeChat handles 82% of mobile payments, Douyin processes $420B in annual transactions.
- Middle East: Ramadan apps see 45% spikes in engagement.
- Africa: Mobile money apps drive 68% of GDP transactions in Kenya.
Aspiring to lead in your app category?
At TekRevol, we provide insights and strategies to position your app as an industry leader.
Achieve Market Leadership
Device-Specific Trends: Smartphones vs. Tablets
Mobile app usage patterns continue to evolve, shaped by advancements in hardware, connectivity, and user behavior.
While smartphones remain the dominant device, tablets have carved out a strong niche in education, gaming, and media consumption.
Understanding the differences in penetration, usage behavior, and monetization trends is key for app developers and businesses looking to optimize user engagement.
This section dives into how smartphones and tablets compare in app downloads, usage patterns, and monetization trends across different regions.
Smartphone App Usage
Global Smartphone Penetration & Adoption
In 2025, an estimated 83% of the global population will own a smartphone. This marks a significant increase from 74% in 2020, fueled by:
- Falling smartphone prices in emerging markets.
- Wider 5G coverage, making high-speed connectivity more accessible.
- App ecosystem growth, with more businesses shifting to mobile-first strategies.
Smartphones remain the primary digital device for billions of users, thanks to their portability and multi-purpose functionality in entertainment, communication, and commerce.
Source: Statista
Top Smartphone Activities & Engagement
Smartphone users engage in a variety of app activities, but three categories dominate overall usage:
- Streaming (40%) – Video and music platforms like YouTube, Netflix, and Spotify are among the most-used apps.
- Gaming (25%) – Mobile gaming continues to rise, with hyper-casual and competitive games (e.g., PUBG Mobile, Free Fire) leading engagement.
- Shopping (20%) – E-commerce apps like Amazon, Alibaba, and Shopee drive mobile retail, with 47% of retail consumption happening via smartphone apps.
Other key smartphone app categories include:
- Maps & Navigation – 96% of U.S. digital map usage happens on smartphones.
- Weather Apps – 86% of weather-related digital content is consumed on mobile.
- Social Media & Messaging – Apps like TikTok, Instagram, and WhatsApp thrive on smartphones due to their instant accessibility.
Why Smartphones Rule:
- Portability: 75% of users shop on-the-go using their smartphones.
- Instant Notifications: 68% of users engage with discount alerts like “50% off in your cart!”
Tablet Niche Usage:
- Streaming: 55% of Netflix and Disney+ binge-watching happens on tablets.
- Gaming: Tablets account for 30% of Roblox playtime, offering a better gameplay experience on bigger screens.
Average Revenue Per User (ARPU) by Device:
- Smartphones: $38/year
- Tablets: $55/year (higher spend on subscriptions like Adobe Creative Cloud)
Most Essential Mobile Apps in 2025
These are the apps users can’t live without in 2025:
| App | Category | Monthly Users | Key Feature |
| TikTok | Social Media | 1.8B | AI-curated For You Page (FYP) |
| YouTube | Streaming | 2.5B | Shorts + Live Shopping |
| Amazon | E-commerce | 1.2B | One-Checkout with Prime |
| Google Maps | Navigation | 1.5B | AR Walking Directions |
| Messaging | 2.4B | End-to-End Encryption |
Why These Apps Stick:
- Amazon: 35% of millennials consider Amazon their most essential app for shopping.
- Google Maps: 80% of users rely on it for real-time traffic updates and navigation.
Spending Trends: iOS vs. Android
| Metric | Apple App Store | Google Play Store |
| 2025 Revenue | $123B | $78B |
| Avg. Spend/User | $101 | $38 |
| Top Revenue Category | Subscriptions (50%) | Ads (55%) |
Why iOS Users Spend More:
- Higher Income Bracket: 45% of iOS users earn $75K+/year vs. 25% of Android users.
- Subscription Culture: 60% of iOS users pay for 2+ services (Netflix, Spotify).
Regional Smartphone App Engagement
Smartphone engagement varies by country, with emerging markets leading in daily usage:
| Country | Avg. Daily App Usage (Smartphones) | Key Usage Trends |
| Indonesia | 5.39 hours | Heavy social media & gaming engagement. |
| Brazil | 5.19 hours | E-commerce and entertainment are dominant. |
| China | 3.33 hours | Growth driven by WeChat & mobile payments. |
| Germany | 3.36 hours | Productivity apps see higher engagement. |
Smartphones remain the preferred choice for on-the-go activities, while tablets excel in longer, immersive experiences like reading and design.
Smartphones vs. Tablets: A Usage Comparison
Both smartphones and tablets support app engagement, but key differences influence user behavior and revenue generation.
App Downloads & Monthly Active Users (MAU)
- Smartphones dominate app downloads, accounting for nearly 90% of total mobile downloads.
- Tablets are preferred for high-value engagement, with longer sessions in streaming and gaming apps.
- Messaging, social media, and e-commerce apps see higher daily active usage on smartphones due to portability.
Monetization Differences
- Tablets have a higher ARPU ($45/year vs. $32 for smartphones), driven by paid apps and premium content.
- In-app purchases and subscriptions perform better on tablets, particularly in gaming and productivity apps.
Key Usage Scenarios: Smartphones vs. Tablets
| Factor | Smartphones | Tablets |
| Primary Usage | Social media, messaging, maps | Gaming, streaming, education |
| Engagement Time | Short, frequent sessions | Longer, immersive sessions |
| Revenue Model | Ads & freemium purchases | Paid apps & subscriptions |
| Top App Categories | Social, retail, utility | Games, design, education |
Tablets are not replacing smartphones, but they complement them in cases where a larger screen enhances user experience.
Tablet Usage Statistics
Despite lower penetration compared to smartphones, tablets play an essential role in specific industries and demographics.
Market Share & Growth
- 12% of total app downloads come from tablets, driven by education, design, and business applications.
- 1.35 billion tablets are in use worldwide (compared to 2.7 billion smartphones), indicating slower but steady demand.
- 30% of tablet users prefer gaming, where the larger screens enhance gameplay and graphics.
Top Tablet App Categories & Engagement
OPD Reimbursement
RankCategory% of UsageKey Apps
1Gaming35%Genshin Impact, Roblox2Streaming30%Netflix, Disney+3Education20%Duolingo, Coursera4Productivity15%Notion, Procreate
Why Tablets Excel in Paid Apps & Subscriptions
- Better visual quality & display size encourage users to invest in premium content.
- Longer session times increase subscription retention rates.
- Enterprise & business adoption – Tablets are widely used in POS systems, digital menus, and corporate training modules.
Regional Differences in Device Preferences
App Downloads by Country
| Country | Smartphone Growth (Since 2019) | Tablet Growth |
| India | 190% increase | Moderate adoption in schools |
| China | 80% increase | Digital art & gaming dominate |
| U.S. | 5% increase | Tablet use growing in education |
Time Spent on Apps (2022 Data)
| Country | Avg. Daily Hours (Smartphones) | Avg. Daily Hours (Tablets) |
| Indonesia | 5.39 hours | 3.10 hours |
| Brazil | 5.19 hours | 2.85 hours |
| Germany | 3.36 hours | 1.50 hours |
| China | 3.33 hours | 1.75 hours |
Tablets see higher engagement in developed markets (U.S., UK, Japan), where users prioritize productivity and entertainment over social media.
Future Outlook: The Evolution of Smartphones & Tablets
Smartphone Trends
- Foldable smartphones could merge tablet functionality with portability.
- AI-powered apps will drive better user personalization.
- 5G expansion will enable faster streaming, AR, and cloud gaming.
Tablet Trends
- Hybrid devices (e.g., iPad Pro, Samsung Tab Ultra) will boost tablet adoption in business.
- Cloud gaming services (Xbox Cloud, NVIDIA GeForce Now) will enhance tablet gaming experiences.
- Education adoption – More schools worldwide will integrate tablets into digital curriculums.
Monetization Shifts
- Ad-supported models may grow on smartphones, as users prefer free-to-use apps.
- Subscription fatigue may impact tablet revenue, pushing new pricing models.
In a nutshell
Smartphones remain the dominant device for daily app usage, while tablets thrive in immersive experiences like gaming, media, and productivity. Businesses should align their app strategies accordingly:
- Smartphone-first strategies for social, retail, and quick-access utility apps.
- Tablet-optimized experiences for education, high-end gaming, and creative tools.
As mobile technology advances, understanding these distinct usage patterns will be crucial in maximizing engagement and revenue.
- Want to outshine competitors in the app store?
- We can guide you through localization and international marketing strategies.
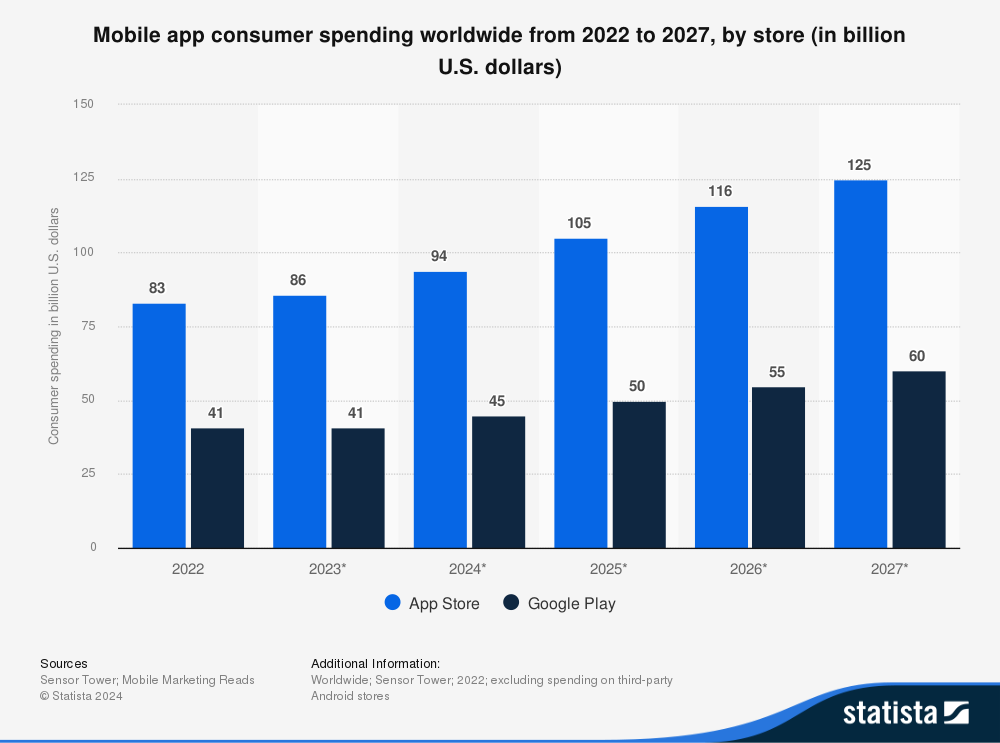
Mobile App Revenue and Monetization Trends
The mobile app industry is on track to generate $935 billion in global revenue in 2025, a 52% increase from 2023.
As app adoption grows, developers are refining monetization models to maximize earnings.
This section explores the breakdown of revenue streams, platform-specific insights, regional hotspots, and emerging monetization strategies shaping the mobile economy.
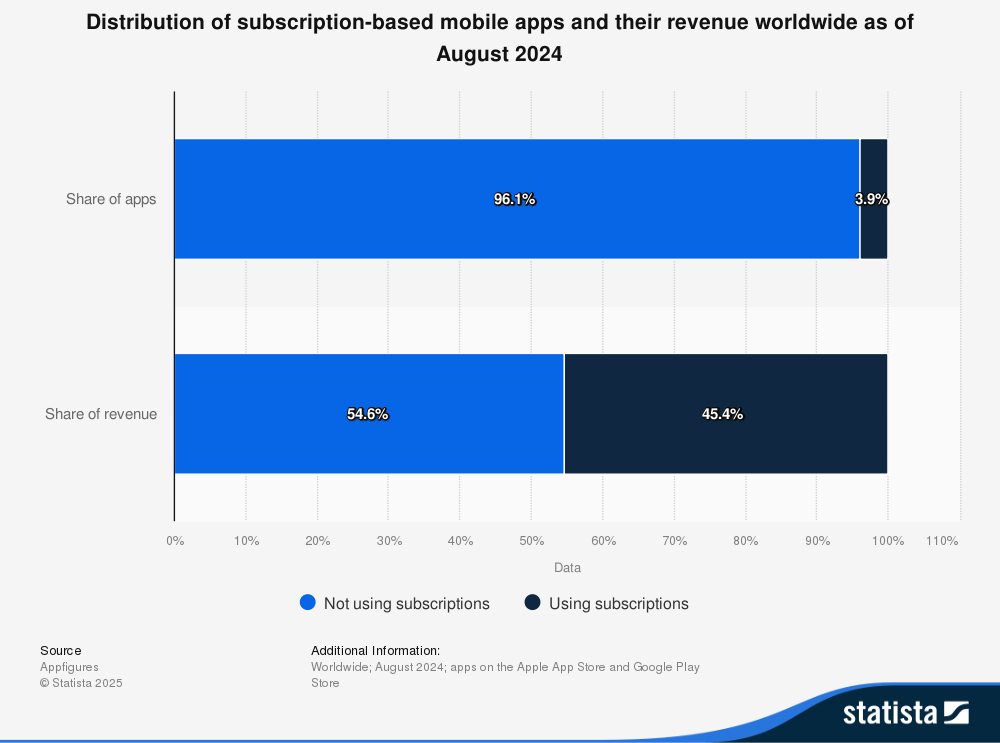
Source: Statista
2025 Global App Revenue Breakdown
The mobile app market is diversifying revenue sources, shifting beyond traditional in-app purchases (IAPs) and advertisements to newer models like subscriptions, Web3 integration, and AI-powered personalization.
Revenue Breakdown by Stream
| Revenue Source | 2025 Projection | % of Total | Growth (vs. 2023) |
| In-App Purchases (IAPs) | $514B | 55% | +32% |
| Advertising Revenue | $281B | 30% | +28% |
| Subscription Revenue | $140B | 15% | +45% |
Key Takeaways:
- Subscription models are the fastest-growing revenue stream (+45%), with platforms like Netflix, Spotify, and Duolingo refining tiered pricing strategies.
- In-game purchases dominate, particularly in Asia, where mobile esports drive premium transactions.
- Advertising revenue surges, led by targeted, rewarded, and AI-enhanced video ads.
Revenue Breakdown by App Category
| Category | 2025 Revenue Projection | Key Drivers |
| Games | $287B | Mobile esports, gacha mechanics |
| Entertainment | $198B | Streaming, interactive content |
| Social Media | $165B | Social commerce, influencer-driven sales |
| Productivity | $85B | AI-powered automation tools |
| Health & Fitness | $70B | Wearable integration, premium plans |
Gaming remains the largest revenue-generating category, but entertainment and social media apps are closing the gap as streaming and shopping integrations become more mainstream.
Platform Wars: iOS vs. Android in 2025
The revenue battle between Apple’s App Store and Google Play Store highlights key differences in user spending behavior.
While Google Play leads in downloads, Apple dominates revenue generation due to higher spending per user.
Revenue Comparison: Apple App Store vs. Google Play Store
| Metric | Apple App Store | Google Play Store |
| 2025 Gross Revenue | $123B | $78B |
| Avg. Revenue Per User (ARPU) | $92/year | $42/year |
| Top Revenue Market | USA (42%) | Japan (18%) |
Key Platform Trends:
- Apple maintains a 2:1 revenue advantage despite Google Play’s larger download volume.
- Google Play is growing faster in emerging markets, especially India (+38% YoY growth), where affordable Android devices dominate.
- iPadOS revenue share increases to 22%, reflecting higher spending on tablet-based productivity and design apps.
Source: Statista
Emerging Monetization Models in 2025
With increasing competition, app developers are moving beyond traditional ad-based and IAP monetization models to more sustainable and engaging revenue streams.
1. Blockchain & Web3 Integration
Web3 and blockchain-powered apps are reshaping in-app economies, particularly in gaming and finance.
- NFT gaming revenue surpasses $12.7B, driven by games like Axie Infinity and STEPN.
- Play-to-earn adoption grows by 65%, with Southeast Asia leading the trend.
- 38% of finance apps now support crypto wallets, with stablecoin transactions gaining traction.
Web3 monetization allows developers to reduce dependency on app store fees, enabling direct user-to-user transactions through NFTs, digital goods, and decentralized economies.
2. Hybrid Subscription Models: Ads + Premium Tiers
Freemium models continue to evolve, with ad-supported tiers gaining popularity among streaming and productivity apps.
- Netflix & Spotify’s ad-supported plans now account for 20% of total subscriptions.
- Freemium conversions increase by 22% with AI-driven paywall optimizations.
- Bundled subscriptions (Microsoft 365, Adobe Cloud, Apple One) drive 30% higher lifetime value (LTV) per user.
Users are willing to pay if given flexible pricing options. Ad-supported tiers allow price-sensitive markets to access services while maintaining revenue streams for developers.
3. AI-Powered Personalization & Dynamic Pricing
AI is revolutionizing monetization, making user experiences more targeted and profitable.
- AI-driven dynamic pricing boosts in-app purchase revenue by 18%.
- Predictive paywalls increase subscription sign-ups by 27%.
- Generative AI tools enable premium features, such as Canva’s Magic Design and ChatGPT-powered writing assistants.
AI can analyze user behavior in real-time, creating personalized pricing and content recommendations that improve conversion rates.
- Looking to expand your app's reach globally?
- We can guide you through localization and international marketing strategies.
Regional Revenue Hotspots: Where Users Spend the Most
While North America and East Asia continue to dominate app revenue, emerging markets are seeing rapid growth in monetization trends.
Top 5 Markets by Mobile App Spending (2025 Projections)
| Country | Total Revenue | Key Monetization Trends |
| USA | $187B | 62% from subscriptions, highest ARPU at $4.32/month |
| China | $159B | 78% of revenue from gaming, mini-program ecosystems |
| Japan | $83B | RPGs dominate spending, highest iOS adoption (72%) |
| South Korea | $47B | Esports drives IAPs, 5G cloud gaming adoption |
| Germany | $38B | Privacy-friendly ad models, productivity app growth |
Notable Regional Shifts:
- China leads in gaming-related spending, with gacha-based mechanics driving microtransactions.
- Japan has the highest iOS penetration, making it a prime market for App Store exclusives.
- Germany sees a shift to privacy-focused monetization, with growth in subscription-based productivity tools.
Future-Proof Monetization Strategies for Developers
As app revenues evolve, developers need to adapt monetization models to remain competitive. The most successful apps will blend multiple revenue streams to maximize profitability.
1. Hyper-Personalization & AI Optimization
- AI-driven recommendations improve in-app spending by 30%.
- Dynamic difficulty adjustments in games retain users longer, leading to higher IAPs.
- Contextual ad placements increase ad revenue without disrupting UX.
2. Cross-Platform Ecosystems
- Users expect seamless transitions between mobile, desktop, and console gaming.
- Shared progress and cloud save monetization models.
- Universal subscription passes increase retention by 20%.
3. Community-Driven Economies
- Creator revenue sharing is increasing in apps like TikTok and YouTube Shorts.
- User-generated content marketplaces drive higher engagement in social and gaming apps.
- Social commerce integrations boost revenue via in-app product sales.
4. Sustainability Monetization
- Carbon-offset subscriptions are growing in travel and fintech apps.
- Eco-friendly rewards encourage sustainable in-app behavior.
- Green NFT initiatives attract environmentally conscious users.
Bottom Line
The mobile app economy in 2025 is thriving, but developers must be strategic in:
- Optimizing revenue per user through freemium, AI pricing, and hybrid subscriptions.
- Tapping into high-growth regions such as India, Southeast Asia, and Latin America.
- Balancing user experience and monetization by offering a seamless revenue model that keeps engagement high.
Future Trends: What’s Next for Mobile Apps?
The mobile app industry is evolving rapidly, with new technologies reshaping user experiences. Looking ahead, three key trends will define the future:
1. AI Integration
- ChatGPT-powered customer service bots are streamlining in-app support, reducing response times by 40%.
- AI-driven automation is personalizing user experiences, increasing app engagement by 30%.
- Predictive analytics are optimizing app retention strategies, with AI-enhanced recommendations boosting conversions by 22%.
2. AR/VR Adoption
- By 2025, 25% of gaming apps will incorporate augmented reality (AR) features, such as AR filters, interactive gaming, and virtual shopping experiences.
- Retail and e-commerce apps are leveraging AR for virtual try-ons, reducing return rates by 18%.
- Education and training apps are implementing VR to create immersive learning experiences.
3. Sustainability Apps
- Carbon-tracking apps (e.g., Joro) are growing at 200% YoY, helping users reduce their carbon footprints.
- Green fintech apps incentivize eco-friendly spending by offering carbon offset rewards.
- Sustainable travel apps help users find eco-conscious accommodations and transport options.
- Need to improve your app's user experience?
- Get expert feedback on UI/UX to enhance usability and satisfaction.
Security and Privacy Concerns
As mobile apps become more integrated into daily life, concerns over data privacy and cybersecurity are escalating.
Data Breaches and Security Risks
- 30% of apps contain critical vulnerabilities, according to the 2024 OWASP Report.
- Mobile fraud cases increased by 27% in 2024, driven by fake apps and phishing scams.
- Biometric authentication adoption has increased 45% to counter security threats.
Regulatory Changes
- GDPR fines reached $2.3 billion in 2024, as governments tighten data protection laws.
- CCPA compliance costs for businesses rose 18% due to stricter regulations.
- Apple’s App Tracking Transparency (ATT) update reduced advertiser tracking efficiency by 39%.
Challenges and Opportunities
- Security Challenges: Rising cyber threats require stronger encryption and zero-trust frameworks.
- Opportunities: AI-powered fraud detection is improving security by 35%, reducing unauthorized access.
Future Projections for Mobile Apps
By 2030, mobile apps will see unprecedented growth, driven by new innovations and user demands.
2030 Forecasts
- Global app revenue projected to hit $565.40 billion, more than 2x the 2025 figures.
- 5G and IoT growth will drive seamless connectivity, enabling real-time, high-performance applications.
- Voice AI apps will replace manual input, increasing adoption in accessibility-focused applications.
Source: Statista
Potential Disruptions
- AI advancements: Fully autonomous AI-driven apps could reduce the need for traditional UI interactions.
- Blockchain integration: Secure transactions and decentralized app marketplaces may disrupt centralized platforms.
- Quantum computing: While still speculative, it could revolutionize encryption, security, and processing power.
Mobile apps are poised for continuous evolution, making innovation, security, and user experience critical success factors for developers and businesses alike.
- Concerned about app security and compliance?
- Ensure your app meets industry standards and protects user data effectively.